Bitcoin's cost basis by generation: this cycle, the losses belong to long-term holders
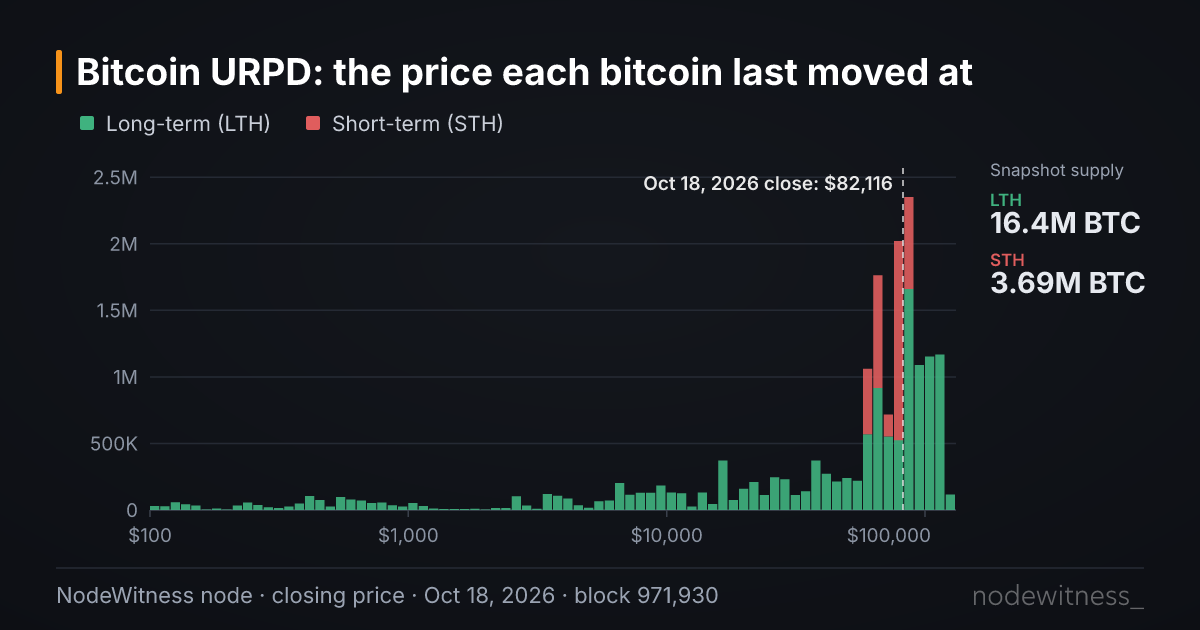
Sort every bitcoin by the price at which it last moved and the November 2026 map has three parts: a quarter of supply cost less than $10,000, almost another quarter sits around the current price, and over a third, bought in 2024 and 2025, is underwater. What's new is who owns those losses: two thirds belong to holders who haven't moved in more than five months.
In our node's UTXO set snapshot of November 8, at block 975,015 and with bitcoin at $74,851, 42.1% of evaluable supply is worth less than its last-moved price [1]. Of those 42.1 points, 28.0 are long-term coins and only 14.1 short-term.
Four years ago, at the 2022 bottom, the split was more even. In 2018 it was close to half and half. That is the point of this piece: not so much how much supply is in loss, which we covered in supply in loss at each price, but which generation of holders carries those losses and how that has changed from one cycle to the next.
One price per coin, not per person
Four limits matter before reading anything into it:
- Moving is not buying. The cost is that of the last move. A transfer between wallets of the same owner, or an exchange reshuffling its wallets, resets the price of those coins even though nobody bought anything.
- We don't cluster entities. We don't group addresses by owner or strip out exchange balances, so the result differs from the entity-adjusted versions other providers publish.
- Lost coins count. The 1.57 million BTC that last moved before August 18, 2010, when there was no market price, count at zero cost and are never in loss [1]. About 0.45% of supply has no assignable date and is left out.
- A snapshot is not a forecast. Working out what would be in loss at another price assumes nobody would move their coins if price got there.
So here a "generation" means the group of coins that last moved within the same price range, not a group of people. And since price has crossed the same levels more than once, a range is not a date: the $60,000 to $70,000 band mixes coins from 2021, 2024 and 2026.
The November 2026 cost map

| Generation by cost | Evaluable supply | Status at $74,851 |
|---|---|---|
| Below $10,000 (mostly pre-2020, including zero-cost 2009-2010 coins) | 25.5% | Deep profit |
| $10,000 – $60,000 (mostly 2020-2023) | 18.0% | Comfortable profit |
| $60,000 – $80,000 (2021, 2024 and 2026) | 23.4% | Around the price |
| $80,000 – $100,000 (mostly 2024-2026) | 21.5% | Moderate loss |
| Above $100,000 (December 2024 – October 2025) | 11.6% | Loss of at least 25% |
Our calculation from the November 8 snapshot's supply in loss at each price [1]. Years are indicative.
Three things stand out. First, the comfortable-profit block is huge: 43.5% of supply cost less than $60,000. Second, break-even is tightly packed, so small price moves flip millions of coins from one side to the other. In the November 1 snapshot, at October's opening price of $83,624, 27.5% of supply was in loss; at the closing price of $77,582, 37.9%. About 2.08 million BTC had a cost basis between the two, as we noted in our October close [1].
The third is the most interesting: coins above $100,000 haven't moved. They have aged and now count entirely as long-term. At $100,000, 11.6% of supply would be in loss and not a single short-term coin would be in that group [1].
The $72,000-$82,000 gap has filled in
The URPD also shows what happens between snapshots. On March 1, 2026, with bitcoin at $65,762, there were three big cost blocks: 12.6% of supply between $60,000 and $72,000, 19.6% between $82,000 and $97,000, and 13.7% between $100,000 and $117,000. Between the first two, a gap: only 1.5% had last moved between $72,000 and $82,000 [1]. That is the trace of a price that ran through the zone in the 2024 rally.
Eight months on, the $70,000 to $80,000 band holds 11.6% of supply, against 2.5% in March [1]. Those are the coins that changed hands in the rebound that occured over the summer and autumn. When old coins are spent, they leave their old band and show up at the price of the day, and you can watch it with the date comparison on the URPD chart.
Long-term holders versus recent buyers
The simplest way to sum up the generations is to split them in two. Long-term holders have an average cost of $48,848 and short-term holders $75,838, per the November 8 snapshot; the whole network sits at $53,994 [1]. With price at $74,851, recent buyers are slightly below their cost: their MVRV, price divided by cost, is 0.987.
That ratio between each group's cost and price marks the phases of the cycle quite clearly, according to our STH/LTH realized price series [1]:
- Euphoria. Recent buyers run well ahead of their cost. Their MVRV hit 1.72 on February 21, 2021, the series high.
- Panic. Recent buyers fall well below it. Their MVRV hit 0.58 on March 12, 2020, the low.
- Capitulation. Long-term holders lose too. Long-term MVRV was below 1 for 41 weeks, in two stretches between November 2018 and January 2023, with a low of 0.73 on December 15, 2018. On November 20, 2022, with bitcoin at $16,260, recent buyers had a cost of $19,093 and long-term holders $20,661: both groups were underwater at once.
This cycle hasn't reached the third phase. Short-term MVRV posted its 2026 weekly low, 0.75, on March 1, and dipped to 0.85 again in June [1]. But price never fell below the long-term holders' average cost: at its closest, on June 28, it was still 19% above.
At tops almost nobody loses; at bottoms, more than half
Our weekly supply in profit series sums up both sides of the cycle.
At tops, virtually every generation is in profit. In the weekly supply-in-profit series, February 21, 2021 and October 5, 2025 leave supply in loss at 0.0%. In the URPD snapshots of those same weeks the count is 0.05% and 0.41%, and in both cases those losses were entirely short-term [1]: at the high, the only ones losing are those who just bought it.
At bottoms it's the reverse, and this is the table we care about most:
| Bottom | Snapshot price | Supply in loss | Long-term | Short-term | Long-term share of losses |
|---|---|---|---|---|---|
| Dec 15, 2018 | $3,232 | 60.32% | 32.2 | 28.2 | 53% |
| Mar 12, 2020 | $4,830 | 55.27% | 32.5 | 23.3 | 58% |
| Nov 21, 2022 | $15,760 | 54.84% | 35.0 | 20.3 | 63% |
| Jun 28, 2026 | $59,497 | 53.9% | 37.2 | 16.8 | 69% |
| Nov 8, 2026 | $74,851 | 42.1% | 28.0 | 14.1 | 66% |
Bottom totals are from the weekly supply-in-profit series [1]. The short/long-term split, and the November 8 snapshot, are from that week's URPD, as points of evaluable supply [1].
Two things change what is usually said about the 2026 bottom. The first is that it wasn't as mild as it looks. Supply in loss reached 53.9% in the week of June 28, with 45.7% in profit, level with 55.27% in 2020 and 54.84% in 2022, not the 50% seen in the early-June snapshots. On June 30 the daily close went lower still, to $58,534, but there is no snapshot for that day. It looks like earlier bottoms in how much is underwater; it differs in who is underwater and how far from cost.
The second is the trend in the last column. At every bottom since 2018, a bigger share of losses has been long-term: from 53% to 69%. It is no longer mainly recent speculators who sit below cost, but 2024 and 2025 buyers who haven't sold. In 2018 and 2022 price dragged several generations into loss at once, long-term holders included. In 2026 the drop stopped above the long-term average cost, but by then the coins of the previous two years already counted as long-term.
How to read the map, and where it fails
The URPD is good for three things:
- Seeing where cost is concentrated. A tall bar means a lot of supply changed hands at that price. A gap means price went through quickly.
- Measuring price sensitivity. The more supply sits near the price, the more coins flip between profit and loss with each move. Right now there are 2.3 million BTC between $70,000 and $80,000 [1].
- Knowing who is losing. Splitting short and long term tells you whether losses belong to newcomers or to holders who are sitting tight.
And it fails in as many ways:
- It isn't support or resistance. Some read a tall bar as a level where people will sell once they're back at cost. The URPD counts coin movements, not intentions, and none of our data lets us say it works that way.
- Internal moves muddy it. When an exchange reshuffles its wallets, hundreds of thousands of BTC are "bought" at once at the day's price. Coinbase did it in November 2025, moving about 800,000 BTC between its own wallets [2][3]. It's one reason the long-term holders in loss series needs careful reading.
- The history carries a bias. The 1.57 million pre-August-2010 BTC stay in evaluable supply at zero cost. If they really are lost, actual supply in profit is somewhat lower than it looks.
- These are weekly snapshots. A daily low like June 30 can fall between two of them. There is also a gap at the start of the series, between January and March 2018.
Back to the opening question
In euphoria every generation is in profit except the latest. At deep bottoms several lose at once, long-term holders included. And in the current, in-between phase, the gains sit with pre-2024 generations, the losses with 2024-2025, and the most recent buyers hover around thier cost.
What has changed is the profile of those holding at a loss. In 2018 they were newcomers and veterans in equal measure. Today they are mostly holders who bought high and haven't sold. Whether that is conviction or just no hurry, the chain doesn't say.
Sources
Source type in brackets.
- NodeWitness, weekly UTXO set snapshots from our Bitcoin Core node since January 12, 2018 (latest, block 975,015, November 8, 2026; also blocks 938,880 of March 1, 2026, 974,069 of November 1, 2026, and the snapshots for each top and bottom cited), valued at the Blockchain.com daily close of each block's creation day; October open and close from Binance BTC/USDT daily candles. Available in the URPD, supply in loss by price, supply in profit and STH/LTH realized price charts. Bottom totals for supply in loss come from the weekly supply-in-profit series (/api/market/supply-profit/history): 60.32% on December 15, 2018, 55.27% on March 12, 2020, 54.84% on November 21, 2022 and 53.9% in loss (45.7% in profit) on June 28, 2026. The short/long-term split, the cost map and the top counts come from the URPD snapshots and /api/market/supply-loss. Data retrieved November 11, 2026. (Primary, own data)
- Coinbase, Transparency Update: Coinbase Executes Onchain Fund Migration, November 2025. (Primary, company statement)
- CryptoSlate, No, 800k BTC didn't hit the market: Why exchange internal transfers fooled traders, November 25, 2025. (Secondary, press)
The cost map updates every week, with date comparison and the short/long-term split, on the URPD chart, in our Supply & Holders section. The 2026 bottom against earlier ones is covered in our realized price analysis.
This article is for information only and is not financial advice.
More in Supply and holders



Last updated: November 11, 2026