
Bitcoin long-term holders in loss: why the peak lags the price bottom
On 16 August 2026, 47.9% of bitcoin that had not moved in over five months was worth less than it cost. That matches the 2018, 2020 and 2022 bottoms. The timing is the interesting part: in every cycle our data covers, the peak arrived after the price had already bottomed.
Most long-term holder coverage says the same thing: they are not selling. This piece looks at something else, how much of what they hold is underwater, computed coin by coin from our own Bitcoin node across 446 weekly UTXO-set snapshots since January 2018.
How it is measured
Every unspent coin older than 155 days counts as long-term, the usual threshold. We price it on the day it last moved and compare that with today. If it cost more than it is worth now, it is in loss. It is the counting version of the realized price: instead of an average cost basis, it tells you how much supply sits above or below the current price.
Four bear markets, one pattern
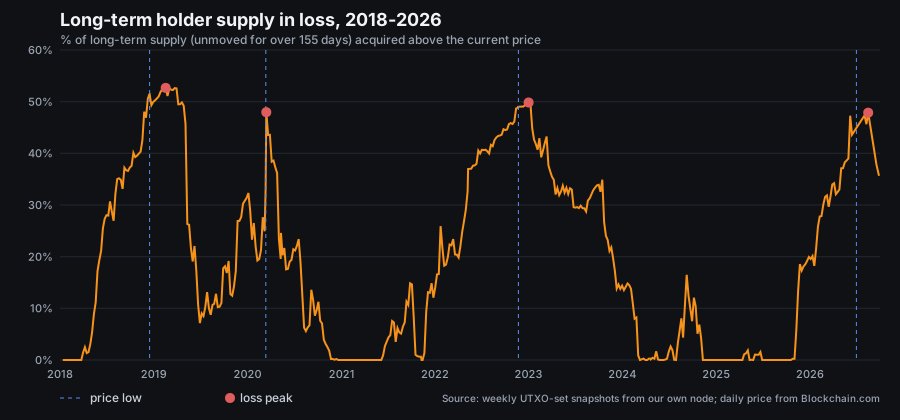
| Cycle | Loss peak | Price low | Lag |
|---|---|---|---|
| 2018-19 | 52.7% (17 Feb 2019) | $3,232 (15 Dec 2018) | ~2 months |
| 2020 | 48.0% (15 Mar 2020) | $4,830 (12 Mar 2020) | 3 days |
| 2022-23 | 49.8% (1 Jan 2023) | $15,760 (21 Nov 2022) | ~6 weeks |
| 2026 | 47.9% (16 Aug 2026) | $58,534 (30 Jun 2026) | ~6.5 weeks |
2026 went as deep as the previous bottoms but did not stay there. The share was above 40% in 6 weekly snapshots, against 28 in 2018-19 and 37 in 2022-23. By 4 October 2026, the latest snapshot, it had fallen to 31.6%, with bitcoin around $84,800.
Why the peak lags
The long-term cohort is not a fixed group. Each week, coins that reach 155 days join it. Buyers from near the top only qualify five months later, and they arrive with their high cost basis, so the in-loss share keeps rising even as the price recovers. In 2026, the low was on 30 June, but coins bought in February and March, when prices were higher, kept aging into the cohort until mid-August.
March 2020 is the exception that fits the explanation: the COVID crash took days, not months, so no batch of expensive buyers aged in after the low. Peak and bottom almost coincide.
The practical reading: a rising in-loss share after a price low is partly an artifact of the metric, not necessarily a second leg down. And the peak is only visible in hindsight.
Data caveats
Almost every snapshot is flagged degraded. Roughly 10-17.6% of long-term supply was created before August 2010, when no reference market price existed, so those coins cannot be priced and are left out. Above 10%, we flag the reading. They are almost certainly in profit; counting them that way would lower the 2026 peak to about 43.1% and the 2019 peak to about 45.6%. The ranking between cycles stays the same.
Two more limits: moving coins between your own wallets resets their age and cost basis without any sale, and ETFs and exchanges pool many clients in a few addresses, blending their behaviour with that of individual holders.
Correction (October 6, 2026): the dated price figures in this article came from our own price series and were off by one day: what we stored as one day's close was the previous day's. They have been corrected. What happened is explained in the Score version history.
Sources
Labelled by type.
- NodeWitness, weekly snapshots of our own Bitcoin node's UTXO set, 446 snapshots from 12 Jan 2018 to 4 Oct 2026; long-term holder supply in loss computed in-house with a 155-day threshold. (Primary, own data)
- Blockchain.com, daily Bitcoin market price, used for each coin's cost basis and each cycle's low. Our copy starts on 18 Aug 2010. (Secondary, price aggregator; the source of the caveat above)
Track supply age on our HODL waves chart and the average cost basis on the realized price chart.
Follow Bitcoin supply and holders measured from our own node, free and without sign-up, in the supply section.
More in Supply and holders



Last updated: October 8, 2026