
Bitcoin's Realized Price, Computed From Our Own UTXO Set (Known Bias Included)
Most realized cap charts you'll find online come from one of a handful of paid data providers, and none of them show you the actual computation. Ours comes from our own node, walking the real UTXO set, and this article is the methodology most trackers skip.
Two numbers that sound similar, measure different things
Market cap multiplies total supply by today's price, as if every coin had been bought this afternoon. Realized price runs the math backwards: it assigns each coin the price from the day it last moved, then sums. The result is, in practice, the network's real average cost basis — and it's the foundation MVRV and NUPL are both built on.
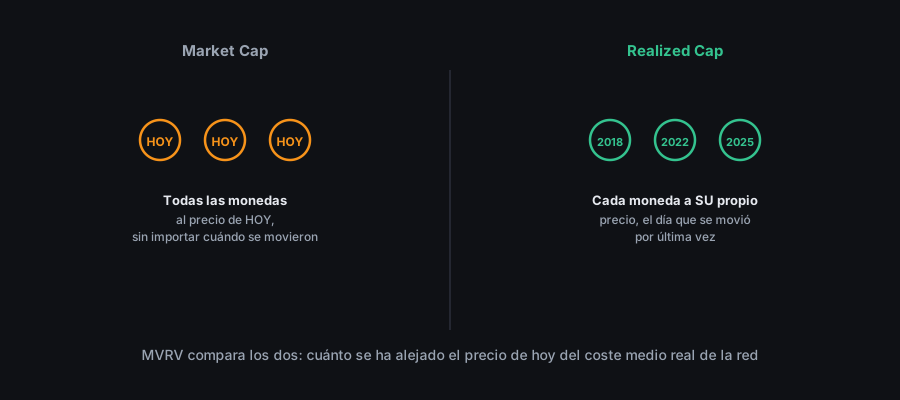
How we compute it: every UTXO, priced on its own terms
We walk the full UTXO set from our own Bitcoin node — the same mechanism already powering our HODL waves — and for each UTXO, look up the block height it was created at. That height maps to an approximate date, linearly interpolated between the difficulty-epoch boundaries we've already computed, not an exact per-block figure, and that date gets matched against historical BTC/USD price. We sum each UTXO's amount times its acquisition price, then divide by total supply.
The bias we don't hide
Here's the nuance most summaries of this metric skip: moving a UTXO isn't always a sale. Something as simple as consolidating UTXOs or migrating to a new wallet resets the "acquisition date" of those coins, even though nobody bought or sold anything. It's a known limitation of realized price in any implementation, not a flaw specific to ours, but we'd rather say it outright than let the number look more exact than it is.
Why a reading sometimes comes back "degraded"
Not every UTXO can be evaluated. When we can't resolve a coin's creation date, or that date falls outside our historical price coverage, that slice of supply gets excluded from the realized cap numerator entirely — we never backfill a guessed price. That unresolved supply still counts in the total used for the denominator, though, so the bias runs conservative: if anything, the resulting realized price is slightly understated, never inflated. When that unresolved share exceeds 10% of supply, we flag the reading as degraded explicitly in the response itself, not something you have to infer by comparing fields yourself.
As of August 2, 2026, with 11.76% of supply unresolved, our calculation put realized price at roughly $50,642 against a market price of $63,389 — an on-chain MVRV of 1.25, computed directly from our own node, not sourced from a third party.
What to do with this number
Realized price doesn't predict anything on its own — like every indicator feeding our Score, it earns its keep combined with the rest, never read in isolation. What it does offer is a different yardstick than market price: how much unrealized gain (or loss) the network is sitting on in aggregate, computed with data we verified ourselves, one UTXO at a time.
Check the live realized price, MVRV, and NUPL computed from our own node in the "Live data" section of Cycle & Score.
Last updated: September 20, 2026