
Bitcoin's Weekly MACD Crossed Zero. Two of the Last Eight Crosses Were Lower a Year Later.
The weekly MACD flip has crypto timelines calling the bull market confirmed. We ran every zero-line cross since 2012 through our own price series: six were followed by higher prices a year out, two by drawdowns of 48% and 64%. On-chain readings today sit firmly in the middle of the range.
The signal is real. In our daily closing series, with Sunday as the weekly close, the MACD line (12-week EMA minus 26-week EMA [1]) moved above zero in the week ending September 27, 2026, and stayed there through October 11. The 9-week signal line was still negative on that date. What the signal is not, on the evidence, is a guarantee.
Eight crosses, two misses
Here is every weekly zero-line cross since 2012 on our series, with the price 52 weeks later:
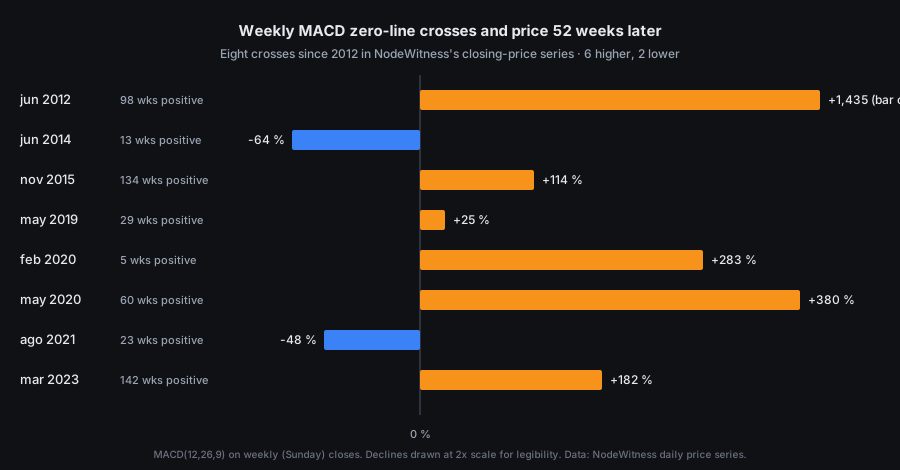
June 2014 and August 2021 both failed: the price was 64% and 48% lower a year after the cross. The 2021 cross is the instructive one. It came with MVRV at 2.32, the highest reading at any cross on the list, and the signal held for 23 weeks before rolling over, long enough to look like confirmation. The Score's August 2021 history shows how that stretch read at the time.
Eight events is a thin sample, and we wouldn't turn it into a hit rate. It is enough to retire the word "always."
What the chain shows instead
Readings from our API on October 14, 2026, between 10:07 and 10:23 CEST:
| Indicator | Reading | Source |
|---|---|---|
| NodeWitness Score | −5.3, Neutral / Transition | Own |
| MVRV | 1.54 (Oct 13) | Coin Metrics [2] |
| MVRV Z-Score | 0.95 (Oct 13) | Coin Metrics [2], own calculation |
| Puell Multiple | 1.10 (Oct 12) | Coin Metrics issuance [2], own price |
| Fear & Greed | 62, Greed | alternative.me [3] |
| Fees, high priority | 1 sat/vB | mempool.space [4] |
| Price | $83,745 | 33% below our record close of $124,777 (Oct 6, 2025) |
Set against the last cycle, that's mid-range on almost every line. MVRV peaked at 3.96 in February 2021 and printed 2.29 on the day of the October 2025 record close; Puell's cycle highs were 3.47 (February 2021) and 2.43 (March 2024). Track both on the MVRV Z-Score chart and the Puell Multiple chart.
The fee line is the one momentum traders tend to skip. A 1 sat/vB mempool, which you can check on our Bitcoin fees today page, means nobody is paying up to move coins. Euphoric phases have not historically looked like that.
Flows and leverage: no stampede either way
Coin Metrics [2] puts net exchange outflows at about 2,918 BTC a day over 30 days, while exchange balances are up 2.6% over 90 days. Binance BTCUSDT open interest [5] fell 3.3% in a week. Neither picture fits a leveraged breakout.
What would count as confirmation on-chain
- MVRV holding above 2, where it went at the last top, for weeks rather than days.
- Puell leaving its middle band while hashrate keeps rising. Friday's difficulty adjustment is currently estimated by our own node at +5.8% as of 10:07 CEST, with 336 blocks to go.
- A fee market that wakes up.
- The Score leaving neutral and staying out.
Our Score has been wrong before, and we keep the record in where the Score has failed. None of this is investment advice or a price forecast.
The Score, MVRV and Puell update daily on the cycle page. Check back in a month to see whether the chain caught up with the MACD.
Sources
Source type in brackets. Primary sources carry the analysis; secondary ones are context.
- StockCharts ChartSchool, MACD (Moving Average Convergence/Divergence Oscillator). Standard definition and parameters. (Secondary, technical reference)
- Coin Metrics, Community Network Data. MVRV, daily issuance, exchange flows and balances. (Primary, data provider)
- alternative.me, Crypto Fear & Greed Index. Reading for Oct 14, 2026. (Primary, index publisher)
- mempool.space, recommended fees. Checked Oct 14, 2026 at 10:23 CEST. (Primary, block explorer)
- Binance, public USDⓈ-M futures API, BTCUSDT open interest statistics (
openInterestHist). (Primary, exchange)
NodeWitness's own data: daily Bitcoin price (Blockchain.com series cached on our system, same-day close), the weekly MACD computed on it, the Score, and the difficulty estimate from our own node.
More in Cycle and valuation



Last updated: October 14, 2026