
The Halving Now Adds 450 BTC a Day. A Single ETF Day Moved 26 Times That.
Bitcoin's supply shock used to be the whole story: fewer new coins, more upward pressure, a peak, a crash, repeat every four years. The mechanism still fires on schedule. It just doesn't move the needle the way it used to, and the numbers that show it are uncomfortable for both sides of the "is the cycle dead" argument.
Every halving cycle produces the same headline debate, usually argued from a hunch rather than from the four completed cycles side by side. Here they are, measured the same two ways each time, next to the one comparison that makes the shrinking supply shock impossible to ignore: what a single day of ETF demand can move against what the protocol itself issues.
The mechanism nobody argues about
Watch the mechanism itself update live on our halving countdown and difficulty adjustment pages, and compare all four cycles overlaid on our cycle comparison chart.
450 BTC a day, and one ETF day moved 26 times that
Here's the comparison that decides how much of a "shock" the halving still is. On September 21, 2026, US spot Bitcoin ETFs took in a net $998.95 million in a single day, their largest haul of 2026 and the third straight day of inflows, per news.Bitcoin.com. At that day's price, that's roughly 11,534 BTC. The halving issues 450 BTC on an average day. One category of buyer, in one session, moved about 26 times what the entire network mines.
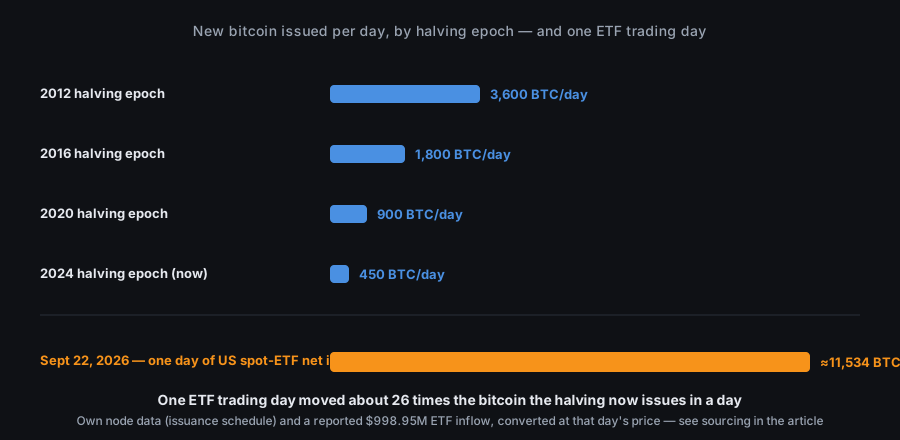
If the halving's scarcity mechanism worked the same way it did in 2012, a single ETF trading day shouldn't be able to dwarf a full day of new supply. It can, and by a wide margin.
Four halvings, four multipliers
Here's what that shrinking supply shock did to price, cycle by cycle, per our own price history:
| Halving | Peak after | Days, halving → peak | Price: halving → peak | Multiple |
|---|---|---|---|---|
| Nov 28, 2012 | Dec 4, 2013 | 371 | $12.45 → $1,136.90 | 91x |
| Jul 9, 2016 | Dec 16, 2017 | 525 | $647.41 → $19,279.90 | 30x |
| May 11, 2020 | Nov 8, 2021 | 546 | $8,617.25 → $67,562.17 | 7.8x |
| Apr 20, 2024 | Oct 6, 2025 | 534 | $63,823.55 → $124,776.68 | 2.0x |
The 2024 halving uses the April 19 close, not April 20's: that halving landed at 00:09 UTC on the 20th, so the last close before it was the previous day's. The other three happened in the afternoon UTC and use their own day's close.
The 2012 cycle is the outlier worth flagging up front: it peaked in 371 days, nearly 150 days sooner than any of the other three, in a market with barely any liquidity to speak of. Treat that first row as the least comparable one, not as the baseline.
The part of the calendar that still holds
Days from halving to peak swing widely (371 to 546). Peak to peak is a different story. December 4, 2013 to December 16, 2017 is 4.03 years. From there to November 8, 2021 is 3.90 years. From there to October 6, 2025 is 3.91 years. Three intervals, all inside a 0.13-year band, across three completely different markets and three completely different sets of participants.
That's the strongest evidence for the calendar side of this argument, and it doesn't move much even if you nudge the exact peak dates by a few weeks.
The case against "the cycle is dead"
Two arguments, and both deserve a fair hearing. First: the calendar is four for four. Anyone calling the cycle dead has to explain why a pattern that survived three prior regime changes would break down on this one. Second: diminishing multiples are the expected outcome for any asset whose market cap keeps growing, not a Bitcoin-specific anomaly. Turning $12.45 into $1,136.90 is a different problem than turning $63,823.55 into a comparable multiple of a market already worth over a trillion dollars. The drop in multiple needs no special explanation; a flat multiple would have been the surprise.
Reflexivity, and a sample size of four
One of the most cited counterarguments comes from BitMEX founder Arthur Hayes. Arkham Intelligence's research (August 20, 2026) lays out his case that the 2013, 2017, and 2021 peaks tracked distinct global liquidity events, post-2008 monetary expansion, yen devaluation against the dollar, and post-COVID money printing, rather than the halving itself. The same piece calls Bitcoin "quite reflexive," more sensitive to halving anticipation and narrative than to the actual supply effect, because it has no earnings or cash flow to anchor its price the way a stock does.
And then there's the sample-size problem we apply on our own where the Score has failed page: four cases, three of them arguably comparable, isn't a statistical pattern. It's a streak.
This cycle's low doesn't look like the prior three either: it's the only one of the four where price never crossed its own realized price, as we documented separately, using the same MVRV ratio we use to compare cycle bottoms here.
What would actually settle this, and why we won't put a date on it
None of this predicts when the next top lands. The patterns already documented on Bitcoin's market tops and bottoms, MVRV, sentiment, the hash ribbon, remain the most verifiable reference we have, and our NodeWitness Cycle Score combines all of them into one live number. What changes here is the framing: "the cycle repeats" and "the cycle repeats at the same intensity" are two separate claims, and only the first one is four for four.
Track the Score, realized price, and the four-cycle comparison updated daily, free and without signing up, on On-Chain Charts.
Correction (October 6, 2026): the dated price figures in this article came from our own price series and were off by one day: what we stored as one day's close was the previous day's. They have been corrected. What happened is explained in the Score version history.
Correction (October 8, 2026): the $998.95 million ETF inflow was dated September 22; it was Monday, September 21, per Farside Investors' daily table.
More in Cycle and valuation



Last updated: October 8, 2026