
Bitcoin's 2026 Low Never Broke Its Realized Price. Every Previous Bear Market Bottom Did.
Bitcoin is up 46% from its July low, and "is the bear market over" is back at the top of everyone's search bar. We don't have a clean answer to that. What we do have is a verifiable line: the July 2026 bottom is the only one of Bitcoin's four completed cycle lows where price never dropped below its own realized price.
We checked this rally against our own indicators back in August and laid out three readings without picking one, plus a concrete watch list. A month on, with price another 10% higher, it's worth revisiting that list against fresh data rather than against a headline.
The number that's different this time
That's a fact about the chain, not a forecast. Track it yourself on our realized price page and the four-cycle comparison chart, cross-checked against Bitcoin's market tops and bottoms.
What's actually driving the move
Two concrete catalysts landed in September. On September 8, price printed a golden cross (the 50-day average crossing above the 200-day), per CoinDesk, which also notes the signal has fired 12 times in Bitcoin's history, held for a full year only 3 of those 12 times (averaging a 250% gain when it did), and produced a milder 24.9% average three-month gain across the other 9. Then on September 22, US spot Bitcoin ETFs pulled in $998.95 million in a single day, the largest inflow of 2026 and the third straight day of gains, according to news.Bitcoin.com. Our own Fear & Greed Index tracked the shift, jumping from 50 ("Neutral") on September 17 to 71 ("Greed") on September 23.
Four bottoms, one line
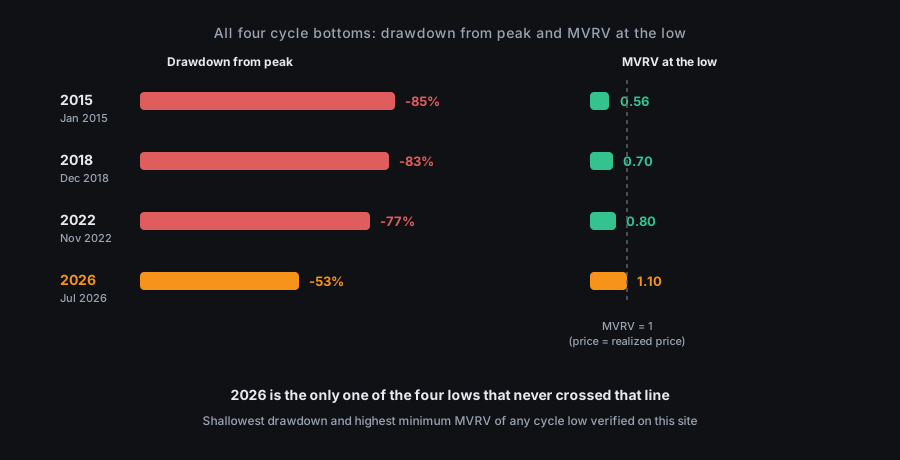
The drawdown was shallower too: -53% this cycle against -77%, -83%, and -85% in the previous three, and it arrived 267 days after the peak, 100 to 140 days sooner than the 364-406 day range of prior cycles. Counted from the halving instead, the 2026 low landed on day 802, squarely inside the 778-925 day range of past cycles. The halving clock says nothing unusual happened; the peak-to-bottom clock does.
What this doesn't prove
A pattern that has held three out of three times is still a sample of three. We apply the same skepticism here that we do on where our Score has failed: three data points don't make a law, and the alternative reading, that this cycle simply hasn't finished correcting and a sub-1 MVRV low is still ahead, is just as consistent with the data we have today. Our NodeWitness Cycle Score currently reads -12, "Neutral / Transition," at 100% data coverage, a mid-cycle reading, not a bottom or a top signal.
The whale share caveat
Wallets holding over 10,000 BTC grew from 14.37% of supply in late April 2026 to 15.14% by September 20, per our own UTXO-set snapshots. Read carefully: our node sees addresses, not owners. A spot-ETF custody wallet or an exchange cold wallet gets counted identically to a convinced long-term holder, and this week's roughly $1 billion in ETF inflows fit that custody effect at least as well as they fit a story about individual conviction. Net exchange flow, per Coin Metrics, has been an outflow on each of the last six days with complete data (September 17-22), widest on the 22nd at roughly 17,000 BTC. That leans toward accumulation, though six days say little about the underlying trend.
The counterpoint nobody should skip
A 46% bounce sounds decisive. It isn't unusual inside a bear market that keeps falling afterward. The three prior cycles each had a rally that size or bigger before the real bottom: +82% (April-June 2014), +66% (February-March 2018), +35% (January-March 2022). This cycle already had its own +31% run between February and May 2026, before price rolled over again into July's low. Today's move beats that one and 2022's, but sits well below the two biggest. Size alone doesn't tell a mid-cycle rally apart from the start of a new bull run.
Scoring our own August calls
In August we set conditions for each of three readings. Here is how they held up:
- Relief rally in a live bear market. Our test was MVRV sliding back toward 1-1.2 without price breaking above the May-July range. Price broke it: the range topped at $82,146 in May, and bitcoin now trades near $85,500. As we framed it, this reading is weaker. Not dead, since relief rallies can clear a range and still fail, but no longer consistent with our own test.
- Start of a structural bull market. We wanted MVRV sustained above 2 and ETF inflows over several straight weeks. MVRV is 1.53, and the inflow streak is three sessions. Not there yet.
- Extended reaccumulation. We expected sideways trading in a higher range with the Score staying neutral. The Score did stay neutral; price didn't go sideways.
What would actually settle this
MVRV is the cleanest tell. Sustained above 2, it would favor the bull reading; drifting back toward 1, it would reopen the case that the real bottom is still ahead. Weeks, not days, of ETF inflows would matter too, and so would price holding above May's old ceiling of $82,146 on any pullback. None of this resolves on a single day's candle, and nothing here is financial advice or a price prediction.
Follow the Score, the MVRV Z-Score, and realized price updated daily, free and without signing up, on the live Score page and On-Chain Charts.
Last updated: September 24, 2026