
What Every MVRV Z-Score Chart Leaves Out: Sample Depth and Shrinking Extremes
Half a dozen free trackers will hand you a live MVRV Z-Score number right now, updated by the minute. None of them will tell you how much historical depth that number actually needs to mean anything, or that the famous 6.5/0 thresholds have been quietly shrinking for three cycles running.
Why the ratio alone isn't enough
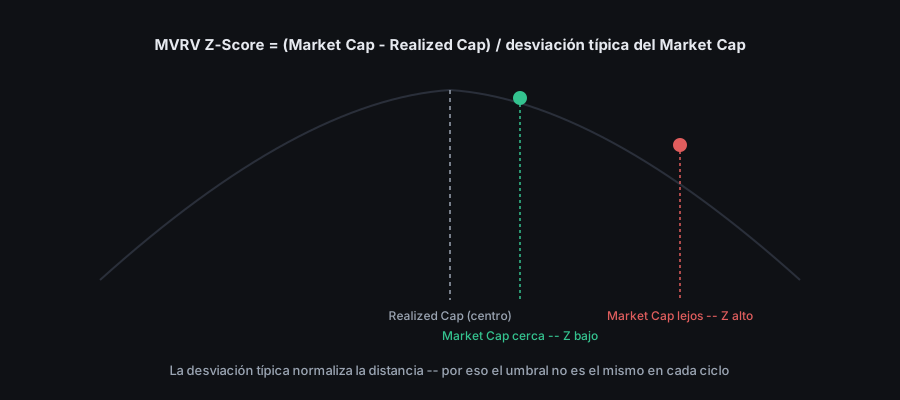
Plain MVRV divides market cap by realized cap. A reading of 3 means the market is pricing coins at three times the network's aggregate cost basis. Z-Score takes the same gap, but instead of a ratio it computes a difference and divides that by the historical standard deviation of market cap itself. The output stops being "how many times" and becomes "how many standard deviations from typical" — a measure that adjusts itself to how volatile the market has actually been, instead of using a fixed scale that means something different in every era.
Why we're not shipping our own series yet
Here's the part most trackers skip entirely: computing a standard deviation that means anything statistically requires a long time series, not a couple of data points. Our own realized price, computed from our node's UTXO set, is only a few weeks old, gaining one new snapshot at a time. Publishing a "proprietary" Z-Score on that little depth would mean showing a number that looks rigorous without being rigorous — exactly what we try not to do anywhere on this site.
What's already live, verified, and updated with every snapshot: plain MVRV and NUPL, computed directly from our node, visible in the "Live data" section of Cycle & Score. Our own Z-Score ships once we have enough accumulated history for that standard deviation to mean something real, not before.
The historical thresholds, with a real caveat
Standard references cite known thresholds: above 6.5 has historically coincided with extreme cycle tops, negative readings with cycle bottoms. Useful reference points, but worth reading against something we've already verified with real data in a related context: Bitcoin's valuation extremes have been compressing cycle over cycle as the market matures. Peak MVRV at each cycle top, for instance, has trended lower across the recent cycles we've analyzed — a fixed threshold calibrated on an older cycle can simply fail to fire in a newer one, not because the top never came, but because the whole range has been shrinking underneath it.
What to do while the native series matures
Treat any MVRV Z-Score reading you see cited, ours included once it exists, as one input among several, never a standalone alarm. Same discipline we apply to every indicator feeding our Score: none of them decide alone, and fixed absolute thresholds age worse than comparisons relative to a metric's own history.
Check the MVRV and NUPL already computed from our own node, updated with every snapshot, on Cycle & Score.
Last updated: September 25, 2026