Get the full PDF free ↓ · 100 pages, in Spanish
Read the Chain: a free guide to Bitcoin's on-chain metrics
On-chain charts are everywhere: MVRV, realized price, HODL waves, hash ribbons. Most of them get shared without the one thing that matters, which is what they actually measure and when they mislead. This guide takes the 20-plus metrics you see quoted most often and explains each one from first principles: how it's built, how to read it at the extremes, and where it breaks.
It won't tell you when to buy or sell, and it doesn't try to predict the price. It teaches you to read the data yourself.
One thing to know first: the PDF is written in Spanish. It's free, in exchange for your email address. Before you decide, you can read chapter 1 below in English, browse the full table of contents and look at three pages from the PDF.
Who it's for
- Bitcoin holders who keep running into these charts and want to know what they're looking at.
- Writers, journalists and analysts who quote on-chain data and want to get it right.
- Node runners curious about what their own node can measure.
You don't need to code or have a finance background.
How each chapter works
Every metric gets the same treatment: what you'll learn, why it matters, an everyday analogy, a toy example small enough to work out by hand, how to read the chart, what history shows (real node data where the metric doesn't need a price, a labelled made-up example where it does), common mistakes, an exercise with its answer, a five-point summary and a short glossary.
Table of contents
- Before you start. What the chain is, what a UTXO is, and how to use (and not use) the guide.
Part 1. Valuation
- Realized cap and realized price: the network's average cost
- MVRV: today's price against that average cost
- MVRV Z-Score: how far the market strays from its cost, measured in volatility
- Short- and long-term holder MVRV: newcomers versus veterans
- Percent of supply in profit: how many coins sit on a gain
- UTXO realized price distribution (URPD): a map of where supply last moved
- Mayer Multiple and the 200-week moving average: price against its own trend
- Pi Cycle Top and the 2-year MA multiplier: two cycle indicators built from price alone
Part 2. Holders and coin behavior
- Short- and long-term holder supply: how much bitcoin sits still and how much moves
- HODL waves: the age of every bitcoin, in layers
- Coin days destroyed (CDD): when old coins wake up
- Dormancy and liveliness: the average age of what gets spent
- RHODL ratio and Reserve Risk: two composite conviction metrics
- Dormant, lost and exposed-public-key BTC
- Total supply and issuance: how many bitcoin exist and how fast new ones appear
Part 3. Network and miners
- Hashrate and difficulty: the computing power that secures the network
- Hash ribbons: when miners switch machines off
- Miner revenue, the fee share and the Puell Multiple
- Fees and the mempool: the queue to get into a block
Part 4. Sentiment
- The Fear & Greed Index: a thermometer for market mood
- Appendix. The NodeWitness cycle phase: combining metrics without fooling yourself
Chapter 14 is still missing its exposed-public-key chart, which will come in a free update. The appendix has no chart and points to the Score's history at nodewitness.com/score/.
Chapter 1, in English: realized cap and realized price
Disclaimer. This is educational material, not financial advice or a recommendation to buy or sell. No metric predicts the price.
What you'll learn
- What realized cap is and how it differs from market cap.
- How to get to realized price, with an example you can do by hand.
- How to read a chart of price against realized price.
- What history shows, and why it isn't a rule.
- The mistakes people make most often with this metric.
Why it matters
Most on-chain valuation metrics are built on top of this one. MVRV, the MVRV Z-Score, the short- and long-term holder versions and the share of supply in profit all start from realized price. Get this chapter and the rest of Part 1 gets much easier.
The intuition
Picture a warehouse where every crate carries a sticker with the price it had the last time it changed shelves. Add up all the stickers and you know what the stock cost when it was last handled, not what it would fetch today.
The blockchain doesn't know who owns a coin or what they paid. What it does record is when each coin last moved. Put the price of that day on every coin, add everything up and you have realized cap. Divide by the number of coins and you have realized price, a rough proxy for the network's average cost.
Nic Carter introduced realized cap on 23 September 2018, in a talk at the Baltic Honeybadger conference in Riga, as a method he had worked out with Antoine Le Calvez [2].
Building it step by step
Illustrative example, fictitious figures. Small enough to work out by hand; not real data.
A tiny network has three coins:
| Coin | Price on the day it last moved |
|---|---|
| A | $5,000 |
| B | $15,000 |
| C | $40,000 |
Step 1. Realized cap. $5,000 + $15,000 + $40,000 = $60,000.
Step 2. Realized price. $60,000 / 3 = $20,000.
Step 3. Compare with the market. If bitcoin trades at $30,000 today, market cap is 3 × $30,000 = $90,000, and the price sits 50% above the average cost.
Step 4. Move a coin. Coin A is sent to a new address today, with the price at $30,000. Its sticker changes from $5,000 to $30,000. Realized cap becomes $30,000 + $15,000 + $40,000 = $85,000, and realized price $85,000 / 3 ≈ $28,333.
The market price didn't change, yet the average cost did. Realized price only moves when coins move on-chain or new coins are mined, since new coins come in at that day's price.
Reading the chart
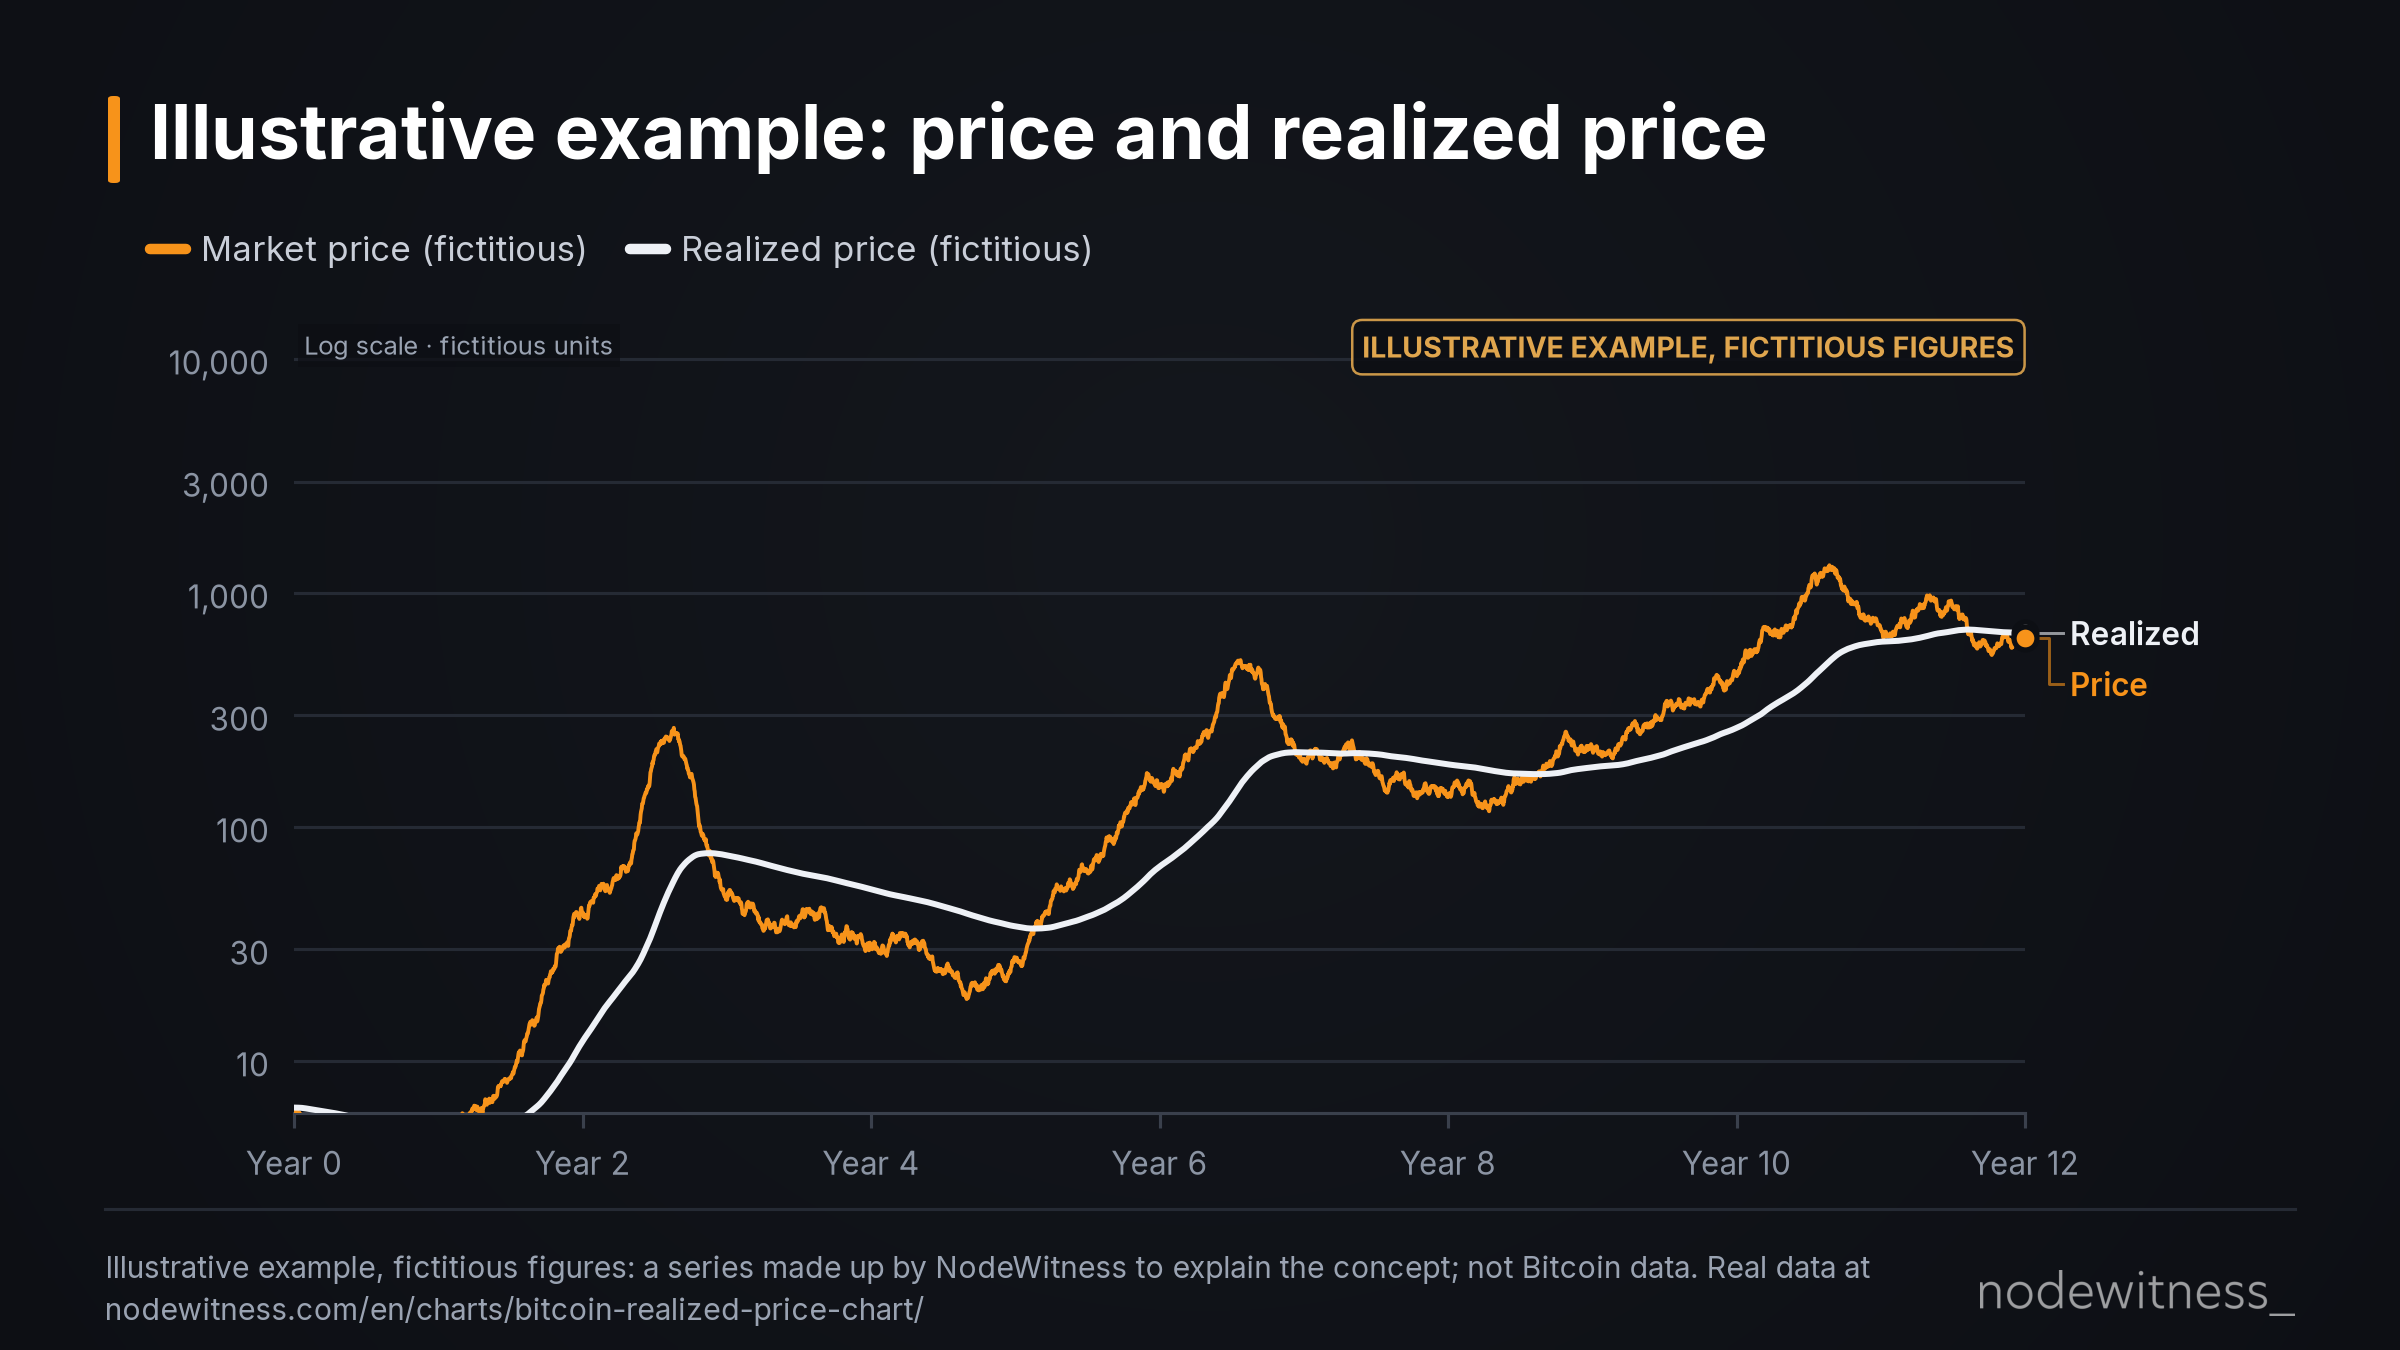
Illustrative example, fictitious figures. NodeWitness made up this series to show how the metric behaves; it doesn't reproduce or rescale any real Bitcoin data. For the real numbers, see the live chart [1]: https://nodewitness.com/en/charts/bitcoin-realized-price-chart/
Look at these first:
- Which line is on top. Price (orange) above realized price (white) means the network as a whole holds unrealized gains. Below it, unrealized losses.
- The gap between them. The wider it is, the larger the paper gain or loss. Expressed as a ratio, that gap is MVRV, the subject of chapter 2.
- The slope of realized price. It climbs slowly and rarely drops hard, because it carries years of accumulated cost.
Don't read too much into:
- A single day's cross. What matters are weeks and months.
- The exact dollar level. Each site lands on slightly different numbers, depending on its price series and adjustments.
What history shows
Context, not a rule. Realized price needs a USD price for every coin, and that price isn't on the blockchain, so this guide doesn't print real realized-price figures. The live chart has them, day by day [1]. To show what to look for there, here are the three lows of the made-up series in the chart above.
Illustrative example, fictitious figures.
| Low in the example | Price (made-up units) | Realized price (made-up units) | Price ÷ realized price |
|---|---|---|---|
| Cycle 1 (year 4.7) | 18 | 43 | 0.43 |
| Cycle 2 (year 8.3) | 117 | 175 | 0.67 |
| Cycle 3 (year 11.8) | 544 | 687 | 0.79 |
In this example, price dips under realized price at every low, and each dip is shallower than the one before. That's one possible pattern, not a law: a real cycle can bottom with price still above realized price. Three cases prove nothing on their own.
Common mistakes
- Treating it as what each person paid. It's the price at the coin's last on-chain move, not its purchase price.
- Treating it as a guaranteed floor. It has worked as a reference, but price has dropped below it more than once; the live chart shows when [1].
- Ignoring internal moves. An exchange reshuffling its wallets re-stickers a lot of coins at once.
- Forgetting lost coins. They still count at the price of their last move, sometimes many years ago.
- Comparing figures from different sites as if they were one series.
Exercise
Open the NodeWitness live realized price chart [1]: https://nodewitness.com/en/charts/bitcoin-realized-price-chart/
- Write down the market price and the realized price.
- Work out how far, in percent, price sits above or below realized price.
- Say whether the network is in unrealized profit or loss.
- Look at the trend of realized price over the last few months: rising, falling or flat?
Answers:
- Both values are shown on the chart, with their date.
- (price / realized price − 1) × 100. A positive result means price is above.
- Price above realized price means unrealized profit; below it, unrealized loss.
- If it's rising, coins are moving at prices above their previous sticker. If it's falling, coins that last moved at higher prices are moving again.
Five ideas to keep
- Realized cap values each coin at the price of its last on-chain move.
- Realized price is realized cap divided by supply: a rough average cost for the network.
- It only changes when coins move or new ones are mined.
- Price above realized price means unrealized gains; below it, unrealized losses.
- Many other metrics build on it, and history shows it as a reference, not a guaranteed floor.
Mini glossary
- Market cap: coins in circulation times today's price.
- Realized cap: the sum of every coin valued at the price of its last move.
- Realized price: realized cap divided by supply.
- UTXO: unspent transaction output, the way Bitcoin records each "coin".
- Unrealized gain: a paper gain, with nothing sold.
How NodeWitness calculates it. The live chart works realized price out from our own node's UTXO set, valuing every unspent output at the price on the day it was created [1]. That price comes from outside the chain, which is why the chart and table in this chapter are deliberately fictitious: you see the shape of the metric without any real figures attached.
Sources
[1] NodeWitness. Live chart: "Bitcoin realized price". https://nodewitness.com/en/charts/bitcoin-realized-price-chart/ [2] Carter, N. (23 September 2018). "Bitcoin as a Novel Market Institution". Baltic Honeybadger, Riga. Talk listing: https://niccarter.info/talks/ · Transcript: https://medium.com/@RainDogDance/bitcoin-as-a-novel-market-institution-nic-carter-talk-at-baltic-honeybadger-2018-e085f163b213
Three pages from the PDF
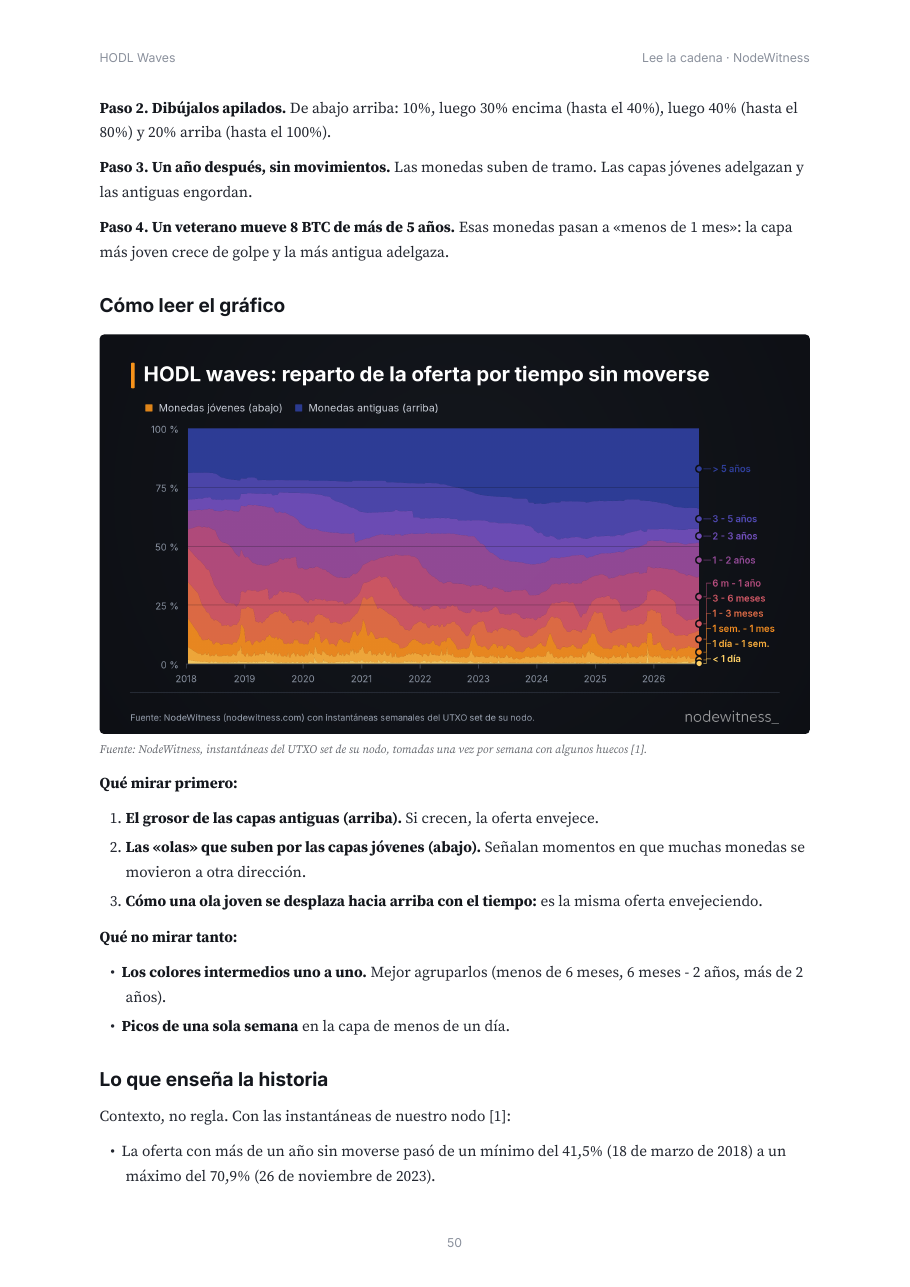
Chapter 10, HODL waves. Weekly snapshots of our node's UTXO set.
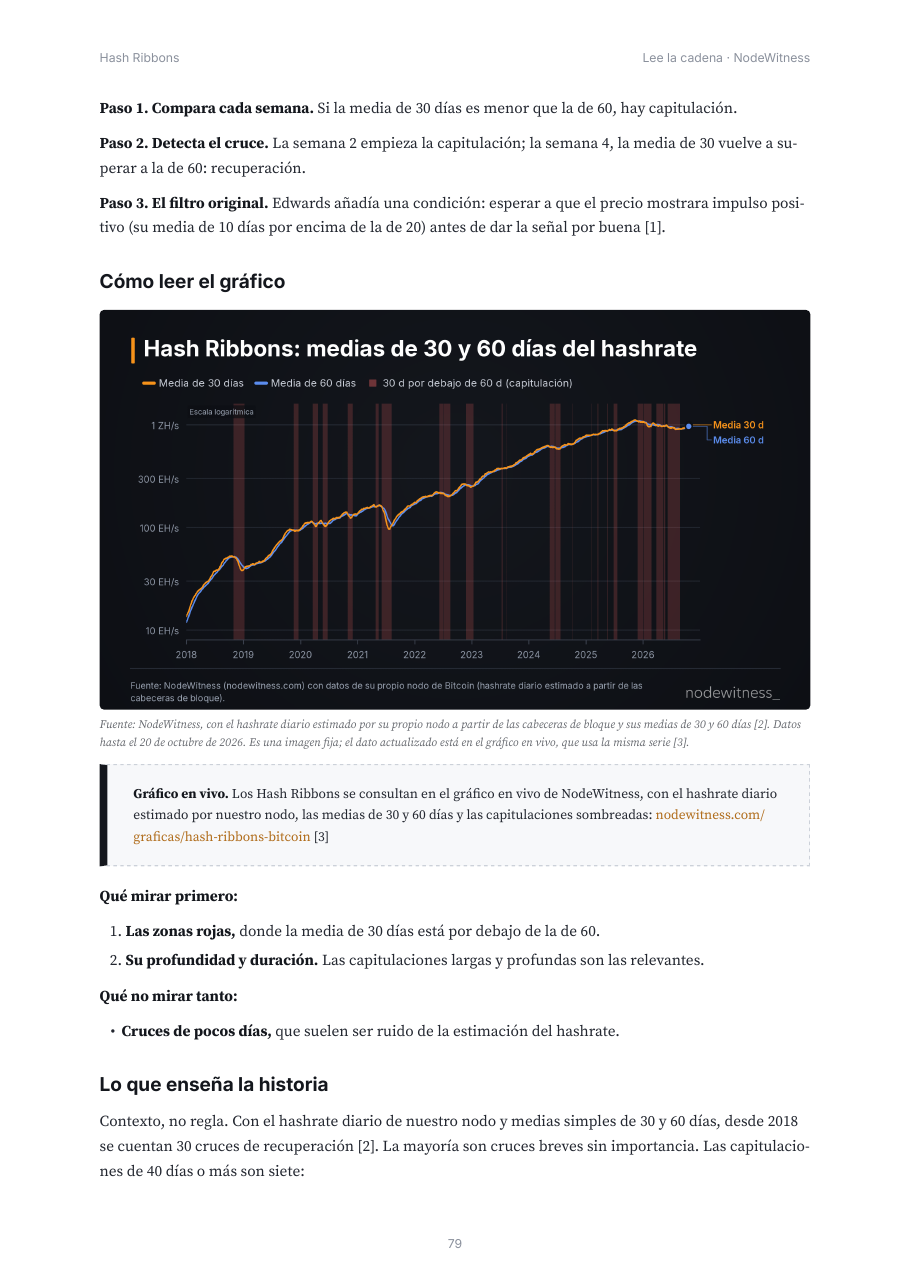
Chapter 17, hash ribbons. Daily hashrate estimated by our node from block headers.
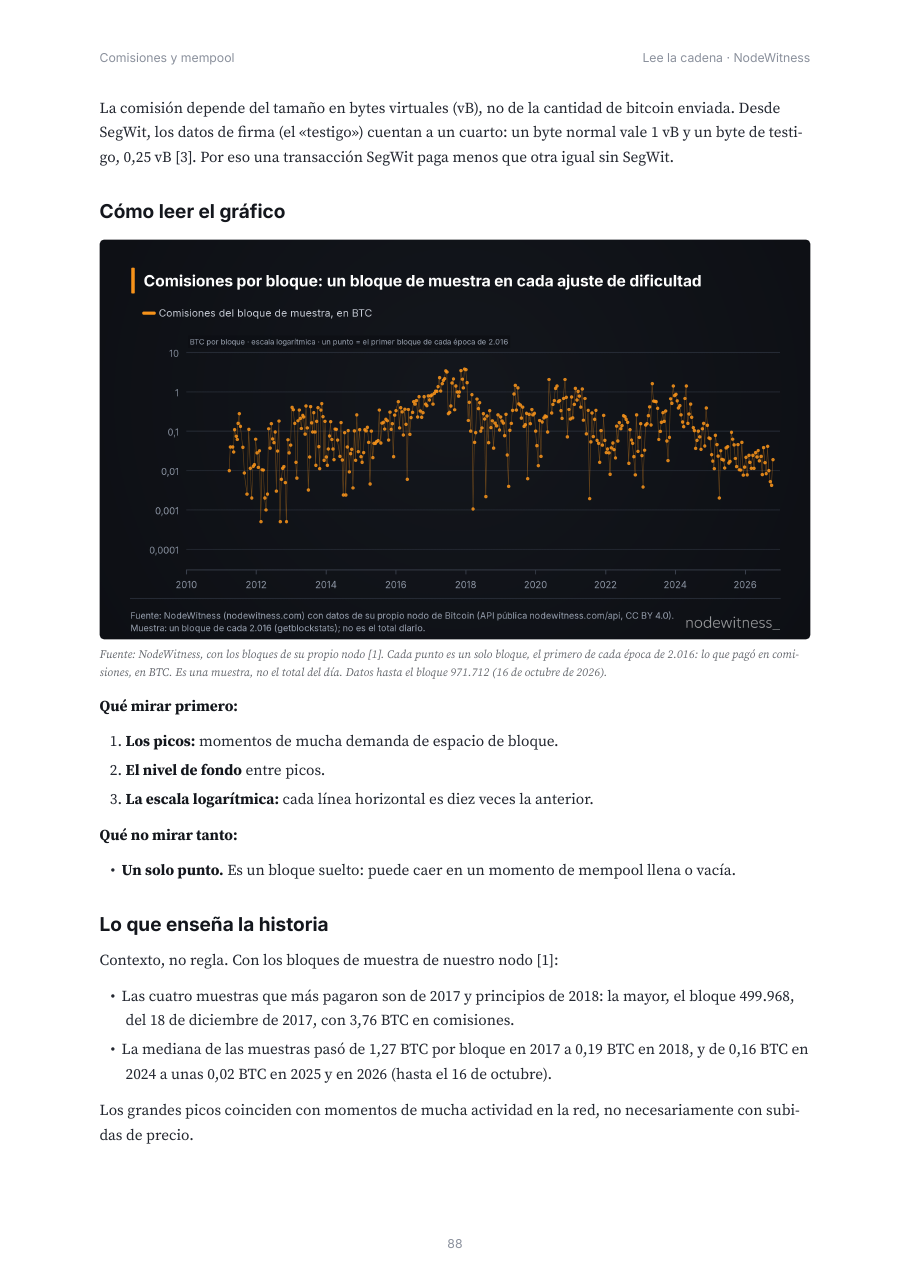
Chapter 19, fees. What one sample block per epoch paid in fees, in BTC, according to our node.
Get the full guide (PDF, 100 pages, in Spanish)
Where the data comes from
We draw every chart ourselves. The only real data in the guide are series from our own Bitcoin node that never touch the price: supply and issuance, hashrate and difficulty, hash ribbons, fees in BTC and HODL waves. We publish them on our API (https://nodewitness.com/api/node/onchain-daily) under CC BY 4.0.
Bitcoin's price isn't recorded on-chain. So every metric that depends on it (chapters 1 to 8, the Puell Multiple in chapter 18, and chapter 20) is taught with made-up example charts and tables: generic shapes, always labelled "Illustrative example, fictitious figures", each linked to its live chart on nodewitness.com for the day's real value. Every chapter numbers and cites its sources.
Credits
"Lee la cadena" (Read the Chain) is a NodeWitness guide. © 2026 NodeWitness. All rights reserved. You may quote short excerpts with attribution and a link to nodewitness.com. Contact: contacto@nodewitness.com.
Educational content. Not financial advice or a recommendation to buy or sell. Past data does not guarantee future results.
Last updated: October 30, 2026