Bitcoin Already Fell 53% in June: The Question Is Whether That Low Was the Cycle Floor
On June 30 bitcoin closed at $58,534, 53.1% below the $124,777 peak of October 6, 2025. That is still the deepest daily-close drop of this cycle, and it is shallower than the −77%, −83% and −85% drawdowns of the previous three. On November 13 price closed at $68,314, 45.3% below the peak and about $325 above the 200-week moving average. The question is no longer whether a classic cycle crash is still coming, but whether that June low was the floor.
A 45.3% drop from the peak looks severe if the only window is the recent slide. In the NodeWitness daily series, though, the worst of this cycle already arrived more than four months ago [1]. Bitcoin closed at $124,777 on October 6, 2025, the high of the series. On June 30, 2026 it closed at $58,534.3, 53.1% lower. Price has since bounced and has come back to the 200-week moving average, without making a lower low.
This Cycle Against the Earlier Ones
| Cycle | Peak | Trough | Drawdown | Time to the trough |
|---|---|---|---|---|
| 2013–2015 | $1,136.9 (Dec 4, 2013) | $172.0 (Jan 14, 2015) | −84.9% | 13.3 months (406 days) |
| 2017–2018 | $19,279.9 (Dec 16, 2017) | $3,231.91 (Dec 15, 2018) | −83.2% | 12.0 months (364 days) |
| 2021–2022 | $67,562.2 (Nov 8, 2021) | $15,759.6 (Nov 21, 2022) | −76.7% | 12.4 months (378 days) |
| 2025–2026 | $124,777 (Oct 6, 2025) | $58,534.3 (Jun 30, 2026) | −53.1% | 8.8 months (267 days) |
Source: NodeWitness daily price series [1]. The 2025–2026 trough is the lowest daily close through November 13, 2026, not a confirmed floor. Months are calendar days divided by 30.44.
In the three earlier cycles the floor arrived 12–13 months after the peak. The June low came at 8.8 months. The 12–13 month window from October 6, 2025 falls in October and November 2026, which is the window we are in now. That does not confirm a floor; it only places the calendar. We have reviewed the pattern of tops and bottoms elsewhere.
Where Price Sits Against the Chain
On November 13 bitcoin closed at $68,314, down 4.3% from the previous day's close ($71,366) [2]. Against three references from our node, that puts the market here:
- Below the cost basis of recent buyers, the short-term holder (STH) realized price, which stood at $75,838 in the November 8 weekly reading (block 975,015) [3]. At $68,314, those coins are worth 9.9% less than they cost on average.
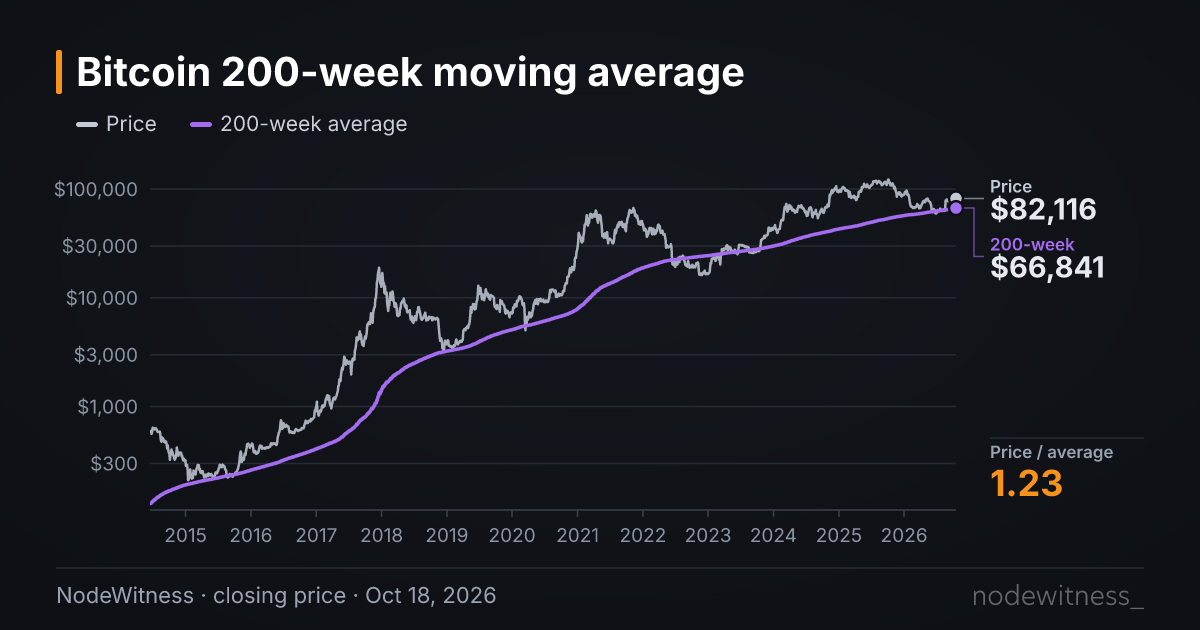
- Almost on the 200-week moving average: $67,989 at the November 13 close, about $325 below the closing price [4]. Since 2014, 55 of 647 weekly closes have finished below that average. The most recent were June 28, August 2 and August 16, 2026 [4].
- Above the network-wide realized price of $53,994 and the long-term holder cost basis of $48,848, from the same November 8 reading [3]. Approximate aggregate MVRV is 1.27. The official MVRV Z-Score series last printed 0.56 on November 12, with the close at $71,366; the November 13 value is not yet published, and an estimate from that reading at the $68,314 close comes out around 0.46 [5].
The June low already left a clue. The June 28 weekly close ($59,497) finished below the average at the time ($62,440), and the June 30 daily low ($58,534) sat 6.5% below that day's average ($62,633) [4]. Realized price in the June 28 reading was $53,220: that low stayed 10.0% above it, with MVRV at 1.10 [3]. As we wrote when we looked at the 2026 low, it is the only one of the four cycle troughs that never lost the realized price.
The holders feeling the most pain now are those who bought in recent months, the same cohort we tracked in bitcoin's cost basis by generation and, this week, when price slipped below Strategy's average cost and the recent-buyer cost basis. The network as a whole, measured by realized price, is still in profit.
What Would Distinguish a June Floor From Another Leg Down
No single cross confirms a floor. Two on-chain references do help separate the two readings, without turning them into a forecast.
The first is the weekly close against the 200-week moving average. Since August 16, every weekly close has finished above it. If that streak holds, the June low — which did lose the average in three isolated weeks — would remain consistent with a floor already in place. A new weekly close below it would fit a deeper leg better. The next weekly close is Sunday, November 15.
The second is realized price. In June, price approached that line and did not lose it. Losing it, or putting MVRV back near 1 on a weekly close, would be a fact this cycle has not yet produced. Staying above it, as so far, does not prove that June was the floor; it only leaves that reading standing.
Neither the 200-week moving average nor the realized price is a buy target, or a level that "holds" or "breaks" in an operational sense. They are two lines the market has already tested this year, which is why they are useful for comparing whatever comes next with what already happened in June.
What to Watch
The near-term reading is the November 15 weekly close against the 200-week moving average. The next is whether price stays above realized price or moves toward the line it did not lose in June. The following weekly short-term holder cost reading also arrives with the Sunday, November 15 close.
Track price against the 200-week moving average on the 200-week moving average chart, recent-buyer cost and realized price on the STH/LTH realized price chart, and the broader picture on the market page.
Sources
Source type in parentheses.
- NodeWitness, daily price series (
/api/market/price-history), retrieved 13/11/2026. Peak-to-trough daily closes for 2013–2015, 2017–2018, 2021–2022 and 2025–2026; 12/11/2026 ($71,365.8) and 13/11/2026 ($68,314.0) closes. (Primary, own data with third-party price) - NodeWitness, daily price series (
/api/market/price-history), confirmed 13/11/2026 close: $68,314.0, −4.28% from the 12/11 close ($71,365.8). (Primary, own data with third-party price) - NodeWitness, realized price by cohort (
/api/market/realized-cohorts/history), weekly reading of 08/11/2026 (block 975,015): realized price $53,994.18, STH $75,837.75, LTH $48,847.99; and the 28/06/2026 reading (realized price $53,220.27) for the 30/06 low. Daily MVRV is approximate, because realized price updates weekly. (Primary, own data) - NodeWitness, 200-week moving average (
/api/market/200-week-ma), retrieved 13/11/2026. Value $67,989.44 at the 13/11/2026 close (price/average 1.0048); 55 of 647 weekly closes below it since 2014; most recent weekly closes below on 28/06, 02/08 and 16/08/2026; 30/06/2026 average at $62,632.86. (Primary, own data with third-party price) - NodeWitness, MVRV Z-Score series (
/api/market/mvrv-z), last official value 0.561 on 12/11/2026 (close $71,365.8). The 0.46 figure for 13/11 is a NodeWitness estimate, not a published series value, obtained by applying the implied deviation from the 12/11 reading and the 08/11 realized price of $53,994 to the $68,314 close. The 13/11 row still had no Z-Score when we checked. (Primary, own data; the 13/11 figure is an estimate)
More in Price and market


Last updated: November 14, 2026