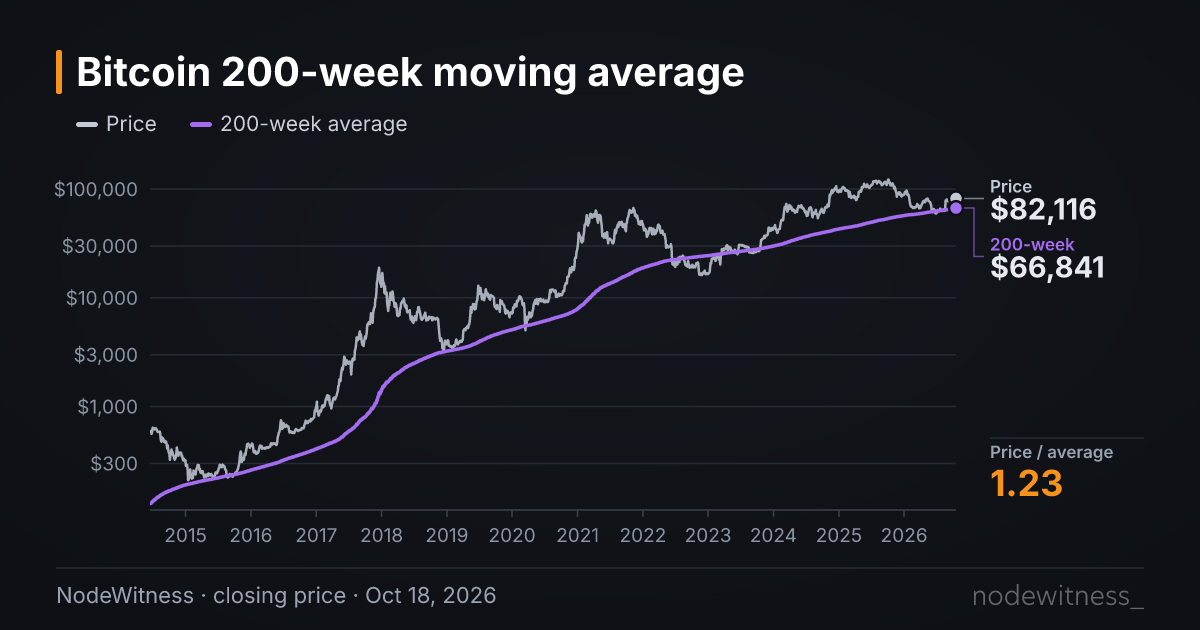
Bitcoin Closes Below the 200-Week Moving Average for the First Time Since August
Bitcoin closed at $64,150 on November 14, a 6.0% drop from the November 13 close, leaving it 5.6% below the 200-week moving average of $67,969. That is the first daily close under the line since August 16, and the deepest one since the June 30 low. At this price, coins bought over the past five months are down about 15% on average, and half of the supply sits below its cost basis.
The slide followed a week of spot ETF redemptions and leveraged long liquidations. In the NodeWitness daily series bitcoin closed at $68,232 on November 13, just above the average, and at $64,150 on November 14 [1][2]. That is the lowest close since August 16 ($62,826) and 25.8% below the October 4 weekly close of $86,488, the high of this stretch [1].
The Close Against the 200-Week Average
Here is how the November 14 daily close compares with this cycle's earlier dips [2]:
| Date | Daily close | 200-week average | Gap |
|---|---|---|---|
| Jun 30, 2026 | $58,534 | $62,633 | −6.5% |
| Aug 16, 2026 | $62,826 | $63,994 | −1.8% |
| Nov 13, 2026 | $68,232 | $67,989 | +0.4% |
| Nov 14, 2026 | $64,150 | $67,969 | −5.6% |
Source: NodeWitness 200-week moving average [2]. The daily value blends the previous 199 Sunday closes with that day's close.
A daily close is not a weekly close. The weekly series is set by the Sunday close, and the November 15 close would have to finish above roughly $67,988 to stay over the average [2]. With price near $64,300 in the latest NodeWitness ticker reading, that requires a 5.7% gain before the close [3]. Failing that, it would be the fourth weekly close below the average in 2026, and the sixth straight lower weekly close since October 4 [2].
Who Is Underwater at $64,150
Our node's weekly reading of November 8 (block 975,015) gives three cost references [4]:
- Recent buyers, meaning coins younger than 155 days, paid $75,838 on average. At $64,150 those coins are worth 15.4% less, an STH MVRV of 0.846. This cohort was already near breakeven when we covered the second day of realized losses, and slipped below it as price fell under Strategy's average cost.
- The network-wide realized price is $53,994. Price remains 18.8% above it, for an approximate aggregate MVRV of 1.19.
- Long-term holders have an average cost of $48,848 and still sit on roughly 31% unrealized gains.
The most direct gauge of pain is supply in loss by price. Using the November 8 cost distribution, about 50.7% of the evaluable supply, some 10.16 million BTC, is below its purchase price at $64,150 [5]. At that reading's own price of $74,851, the share was 42.1%. Of the 50.7%, around 16.1 points are coins younger than 155 days and about 34.7 points are older coins, many bought near the 2025 top, as our cost basis by generation piece showed.
ETFs and Leverage
US spot bitcoin ETFs recorded net outflows in seven consecutive sessions, November 5 through November 13, for a combined $1.907 billion according to Farside [6]. November 13 alone saw $185.4 million leave, $143.5 million from BlackRock's IBIT and $41.9 million from Fidelity's FBTC.
Leverage added to the move. CoinGlass data cited by Investing.com show $1.47 billion of positions liquidated across exchanges in 24 hours, $1.31 billion of them bullish bets, with about $677 million in bitcoin positions [7]. The same report puts the intraday low at $63,403, the weakest level since August.
How This Close Differs From June
In June the average was lost and the realized price was not. The June 30 low held 10.0% above the realized price of the time, as we laid out when asking whether June marked the cycle floor. At $64,150, price is 9.6% above that low and 18.8% above the current realized price.
None of these lines is a buy level or a forecast. They are yardsticks. A weekly close under the average that stays well clear of the realized price would repeat the June and August pattern. A move toward the realized price, or an aggregate MVRV near 1, would be something this cycle has not yet seen. The next weekly cohort cost reading arrives with the November 15 close.
Track price against the average on the 200-week moving average chart, recent-buyer cost on the STH/LTH realized price chart, and how much supply is underwater at each price on the supply in loss by price chart. Everything else is on the market dashboard.
Sources
Source type in parentheses.
- NodeWitness, daily price series (
/api/market/price-history), retrieved 11/15/2026. Closes on 11/13/2026 ($68,232.3), 11/14/2026 ($64,150.0), 08/16/2026 ($62,826.1), and the 10/04/2026 weekly close ($86,488.0). (Primary, own data with third-party price) - NodeWitness, 200-week moving average (
/api/market/200-week-ma), retrieved 11/15/2026. Average of $67,968.62 at the 11/14 close (price/average 0.9438) and $67,989.04 at the 11/13 close; 55 of 647 weekly closes below since 2014; 2026 weekly closes below on 06/28, 08/02 and 08/16; weekly closes falling from 10/11 to 11/08. The $67,988 threshold is a NodeWitness calculation from the previous 199 Sunday closes. (Primary, own data with third-party price) - NodeWitness, ticker (
/api/market/ticker), reading of 11/15/2026: $64,310 (CoinGecko price). (Secondary, aggregator) - NodeWitness, realized price by cohort (
/api/market/realized-cohorts/history), weekly reading of 11/08/2026 (block 975,015): realized $53,994.18, STH $75,837.75, LTH $48,847.99; daily series for 11/14 with STH MVRV 0.8459, LTH MVRV 1.3133 and approximate MVRV 1.1881. (Primary, own data) - NodeWitness, supply in loss by price (
/api/market/supply-loss), 11/08/2026 distribution (block 975,015) evaluated at $64,150: 50.75% in loss (10,159,480 BTC), 16.08 STH points and 34.67 LTH points; 42.14% at the reading's price ($74,851.4). (Primary, own data) - Farside Investors, "Bitcoin ETF Flow (US$m)", retrieved 11/15/2026. Net flows from 11/05 to 11/13/2026: −430.2, −411.9, −201.0, −95.0, −299.8, −284.1 and −185.4 million dollars. (Secondary, aggregator) https://farside.co.uk/btc/
- Investing.com, "Bitcoin falls below $64,000 as ETF outflows extend to seventh straight day", 11/14/2026, citing CoinGlass and SoSoValue data. (Secondary, press) https://www.investing.com/news/cryptocurrency-news/bitcoin-slides-below-68000-as-anthropic-ipo-frenzy-drains-market-liquidity-5027106
More in Price and market


Last updated: November 15, 2026