
Treasuries at 5%, Hormuz and a Fed hike: what past macro shocks did to Bitcoin on-chain
The 10-year Treasury closed at 5.28% on 7 October, its highest since 2002, and the Fed has hiked again. The macro story is everywhere. What is not: what actually happened inside the blockchain the last three times the macro broke, measured on our own node.
You have probably read the macro takes already. This piece keeps that part short and sourced, and spends its length on the one thing we can add: weekly snapshots of Bitcoin's UTXO set from our own node, which show which coins moved when prices collapsed. Sources are listed at the end, labelled by type. Where a source is secondary, we say so in the text and lean on it lightly.
The backdrop, as of 28 September 2026
- Rates. The 10-year Treasury closed at 5.24% on 28 September, up from 3.97% on 27 February; the 30-year at 5.56% [1]. On St. Louis Fed daily data, the 10-year last traded this high in June 2007 [2]. The 30-year was at its highest in Treasury data since January 2002, with a caveat: Treasury published no 30-year rate between February 2002 and February 2006 [1]. Both have kept climbing since: on 7 October the 10-year closed at 5.28%, a level last seen in May 2002, and the 30-year at 5.67%, the highest since July 2001 [1].
- The Fed. A 25 bp hike to 3.75-4% on 16 September, by a 12-0 vote [3]. The median dot points to 4.1% by year-end and 3.7% PCE inflation for 2026 [4].
- Oil. EIA's spot Brent went from $71.32 on 27 February to $138.21 on 7 April and sat at $114.89 on 22 September [5]. Headlines quoting "$107" refer to the front-month future, which trades below spot. Hormuz saw 132 transits in the week of 21-27 September against roughly 130 a day before the war, per press reports [6].
- Russian refining. A refinery hit on average every three days in January-August; June throughput of 3.8 mb/d, the lowest in over 20 years [7].
- Liquidity and the dollar. Two things that cut against the usual narrative: the Fed's balance sheet has grown since December ($6.54T to $6.75T) [8], and the broad dollar index, at 120.33 on 25 September, sat inside its 2026 range; by 1 October it had edged above it, to 121.79, a 2026 high [9].
- Politics. Midterms on 3 November, with all House seats and 35 Senate seats up [10].
Why the macro reaches Bitcoin at all
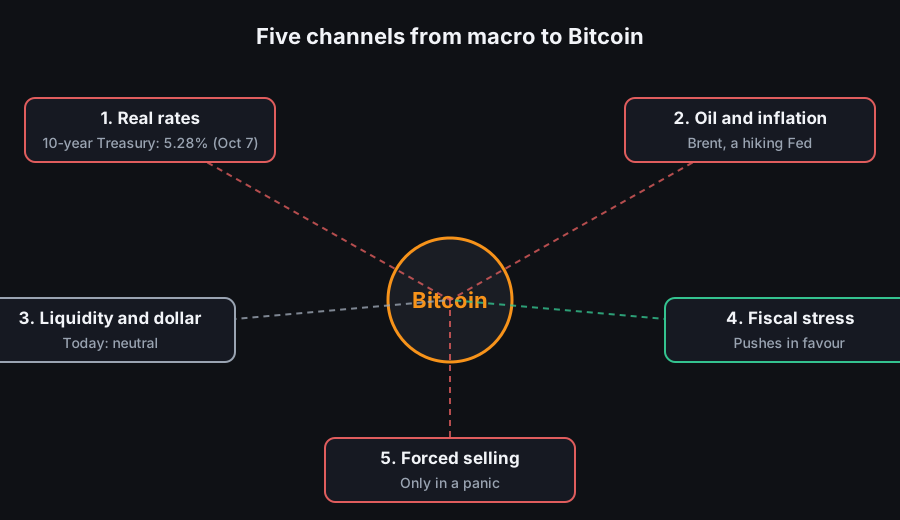
In short: rates raise the opportunity cost of holding a non-yielding asset (the channel that ran 2022); oil keeps inflation up, which keeps the Fed hiking; liquidity is neutral for now, since tightening runs through rates, not the balance sheet; fiscal stress pushes the other way, feeding the debasement argument that also lifted gold; and forced selling in a genuine liquidity panic hits everything at once. That last channel is short and violent, and it is the one where on-chain data has something to say.
What our node saw in 2020, 2022 and 2024
If long-term holders capitulate in a panic, the share of coins unmoved for over a year has to fall. If recent buyers are the ones selling, the share moved in the last week spikes. Here is what our HODL waves recorded:
| Shock | Price drawdown | Moved in past week | Unmoved over 1 year | Node MVRV |
|---|---|---|---|---|
| COVID, March 2020 | −53% (14 Feb → 12 Mar) | 3.96% → 7.53% | 59.18% → 58.94% | 1.53 → 0.92 |
| Luna/3AC, June 2022 | −52% (4 May → 18 Jun) | 3.41% → 7.37% | 64.93% → 65.23% | → 0.84 |
| FTX, November 2022 | −26% (5 Nov → 21 Nov) | 3.72% → 5.96% | 66.75% → 66.79% | → 0.82 |
| Yen carry unwind, August 2024 | −21% (28 Jul → 5 Aug) | no visible change | 66.05% → 65.83% | 2.17 → 1.93 |
In each of the three big shocks, the share of coins moved in the past week rose by 60% to more than double, while the share held for over a year stayed flat or rose. The coins changing hands were mostly young. In all three, the market also traded below the node's realized price, the average cost at which every coin last moved.
Are those spikes unusual? Across our 452 weekly snapshots since 2018, the median share moved in the past week is 3.50%, and only one week in twenty exceeds 5.68%. March 2020 (7.53%) and June 2022 (7.37%) rank among the five highest readings in the series. But so do January 2021 (7.32%) and November 2020 (6.37%), both mid-rally. High turnover is not a panic signature on its own: euphoria produces it too.
And there are two weeks when old coins did move in size. Neither was a macro shock:
- December 2018, the capitulation to $3,200. In the week to 9 December the over-one-year share fell 2.52 points, mostly from the 3-5 year band.
- November 2025, the slide from the October high. In the week to 23 November it fell 2.51 points, almost all of it in a single day: 4.55% of supply moved within 24 hours. That shape fits a large custodian rotating wallets better than thousands of holders selling at once. Custody rotations by large holders were documented around then, such as Strategy's, analysed by Arkham [12], but that one was a week earlier and far smaller, so it does not explain the move. Our data cannot attribute it.
What this does not show:
- Moved is not sold. Exchange shuffles, custodian changes and wallet migrations count too. November 2025 is the reminder.
- August 2024 is invisible at this resolution. Our snapshots are weekly; the 4 August one predates the worst day (5 August), and the next one already reflects the rebound.
- Three macro shocks. Consistent with each other, not a law.
Today, on the same measures
The latest age snapshot, from 4 October, shows 2.95% of supply moved in the past week, below the series median of 3.50%; 121 of 452 weeks are that low or lower. Turnover is still quiet, if no longer as unusually so as in mid-September, when it touched 2.33%. The share unmoved for over a year is 63.17%. The realized-price snapshot from the same day puts node MVRV at 1.59, against a realized price of about $53,400.
The honest reading: there is no on-chain trace of panic today. There was none on 11 March 2020 either. These measures describe the present; they do not forecast.
One more data point, from a weaker source. Bitcoin went from $76,142 on the day of the Fed hike to $83,471 twelve days later, a stretch in which US spot ETFs took in $2.4 billion in the week to 25 September, per The Block citing SoSoValue [11]. That figure comes from an aggregator, not an official filing, so we note it as context and draw nothing from it.
Not a black swan
A black swan is, by definition, unforeseen. Everything above is on the front pages. What is unusual is the stacking: an energy shock, a hiking Fed, long yields at two-decade highs and an election that may change control of Congress. Polls favour the Democrats, but the aggregate we found is on Wikipedia [10], so it carries little weight here.
And no indicator we publish saw 2020, 2022 or 2024 coming. Our Score read "Neutral" at the 2018 and 2020 lows; we document that on where the Score has failed. Anyone claiming their indicator anticipates macro shocks should show their track record.
What to watch
- Coins moved in the past week. A spike with falling prices fits the 2020 and 2022 pattern of recent buyers selling. A sharp drop in the over-one-year share at the same time would look like December 2018, and would need checking for custodian moves before reading it as selling.
- MVRV versus 1. Below 1, the market trades under the average cost basis, as in 2020 and
- The next inflation print and FOMC meeting. The median dot already implies another hike [4].
- The Fed's balance sheet. If it starts shrinking, liquidity joins the rates channel.
None of this is financial advice. For buying without trying to time any of it, see what DCA is.
Correction (October 6, 2026): the dated price figures in this article came from our own price series and were off by one day: what we stored as one day's close was the previous day's. They have been corrected. What happened is explained in the Score version history.
Correction (October 8, 2026): an earlier version said the 30-year hadn't paid 5.56% since June 2004. Official data can't support that: Treasury published no 30-year rate between February 2002 and February 2006. In its tables, it was the highest level since January 2002.
Sources
Labelled by type. Primary sources carry the analysis; secondary ones are context only.
- US Department of the Treasury, Daily Treasury Par Yield Curve Rates, 2026, and the 2002 table for the 2002 comparison. (Primary, official)
- Federal Reserve Bank of St. Louis, FRED, DGS10 and DGS30. (Primary, official)
- Federal Reserve, FOMC statement, 16 September 2026. (Primary, official)
- Federal Reserve, Summary of Economic Projections, September 2026. (Primary, official)
- US Energy Information Administration, Brent spot price, via FRED, DCOILBRENTEU. (Primary, official)
- Al Jazeera, "Oil prices surge after Trump rejects Iran's plan to reopen Strait of Hormuz", 28 Sep 2026. (Secondary, press)
- International Energy Agency, "Russian refining sector struggles amid intensifying Ukrainian attacks", 17 Sep 2026. (Primary, international agency)
- Federal Reserve, H.4.1 weekly balance sheet, via FRED, WALCL. (Primary, official)
- Federal Reserve, H.10 broad dollar index, via FRED, DTWEXBGS, and the H.10 release of 5 October 2026. (Primary, official)
- Wikipedia, 2026 United States elections. (Secondary, collaborative encyclopedia; low weight)
- The Block, "Bitcoin ETFs turn positive for 2026 with $2.4 billion weekly inflow", 26 Sep 2026, citing SoSoValue. (Secondary, press on an aggregator; low weight)
- Arkham Intelligence, "Why Strategy is moving BTC to new wallets", 14 Nov 2025. (Secondary, on-chain analytics firm using its own labels; low weight)
NodeWitness data: Bitcoin price (daily Blockchain.com series cached on our side), HODL waves, realized price and MVRV from weekly UTXO-set snapshots of our own node. Check them on HODL waves and realized price.
Follow the cycle phase, MVRV and global liquidity daily, free and without sign-up, in the market section and on the live Score page.
More in Price and market


Last updated: October 8, 2026