
Bitcoin DCA Explained: What a Real Backtest Adds Beyond a Calculator
DCA means investing a fixed amount at regular intervals instead of all at once. Most DCA content stops at a calculator that projects a plan forward. Score DCA is different: it backtests an adjusted version of DCA against real historical Score data, and shows you both the wins and the losses.
DCA (Dollar Cost Averaging) means investing a fixed amount at regular intervals — say, $50 every week — instead of putting all your money in at once. Its advantage isn't maximizing gains, but eliminating the worst possible decision: going all-in right before a crash. Below: the mechanics in short, the real trade-offs, and how Score DCA tests a cycle-aware variant against real history instead of a static projection.
The basics, briefly
DCA stands for Dollar Cost Averaging: instead of investing all your money at once trying to guess the best moment, you invest a fixed amount at regular intervals — $50 every week, $200 every month — no matter what the price is doing.
Nailing the exact entry point is nearly impossible, even for professionals. Spread your purchases out over time and the average price across all of them smooths out: you give up the best possible move — catching the exact bottom — in exchange for avoiding the worst one — putting all your capital in right before a crash. For most people, especially in an asset as volatile as Bitcoin, that trade-off is worth it.
A simple example
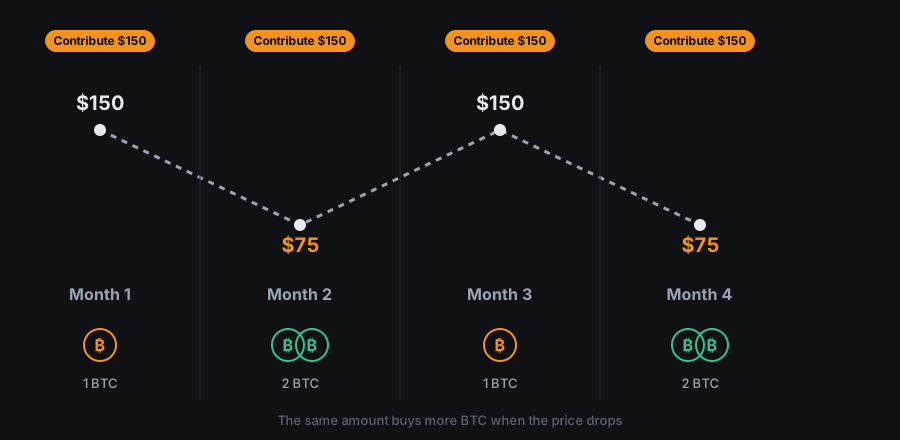
Imagine you decide to invest $150 a month in Bitcoin for four months, and the price swings up and down instead of trending one way:
- Month 1: Bitcoin at $150 → you buy 1 BTC
- Month 2: Bitcoin at $75 → you buy 2 BTC
- Month 3: Bitcoin at $150 → you buy 1 BTC
- Month 4: Bitcoin at $75 → you buy 2 BTC
You've invested $600 and hold 6 BTC, so your average purchase price is $100 per BTC — a third below the $150 you'd have paid going all-in on month 1, without having to guess anything. In the cheap months, that same $150 bought twice as much Bitcoin. DCA automatically makes you buy more when the price drops and less when it rises, without you having to decide anything. That's the entire mechanism.
DCA in one breath: advantages and limits
Not magic — a trade-off. Worth knowing both sides before using it:
Advantages:
- Enforces discipline. Automatic, regular contributions avoid the two classic emotional traps: buying out of euphoria at highs, freezing out of fear at lows.
- Reduces the worst case. Spreading your entry out makes it mathematically impossible to put all your capital in on the single worst day.
- Removes the need to time the market. Nobody does this consistently well, not even professionals — DCA sidesteps the question entirely.
Limits:
- It's a discipline, not a signal. Traditional DCA has no opinion on whether the market is cheap or expensive — it contributes the same amount regardless. That's exactly the gap Score DCA fills, below.
- Doesn't protect against a prolonged bear market. If the price falls for years, continuing to contribute lowers your average cost, but the portfolio stays underwater for as long as the drop lasts.
- Doesn't maximize returns. In a market that trends up over the long run, investing everything upfront (lump sum) tends to beat DCA — the earlier you're in, the longer your money is exposed to the rise. DCA trades upside for lower risk, not the reverse.
What Score DCA is and how it differs
Traditional DCA always invests the same amount, regardless of whether the market is expensive or cheap. Score DCA changes exactly that: instead of always contributing the same, it adjusts how much you invest each period based on the cycle phase marked by the Score.
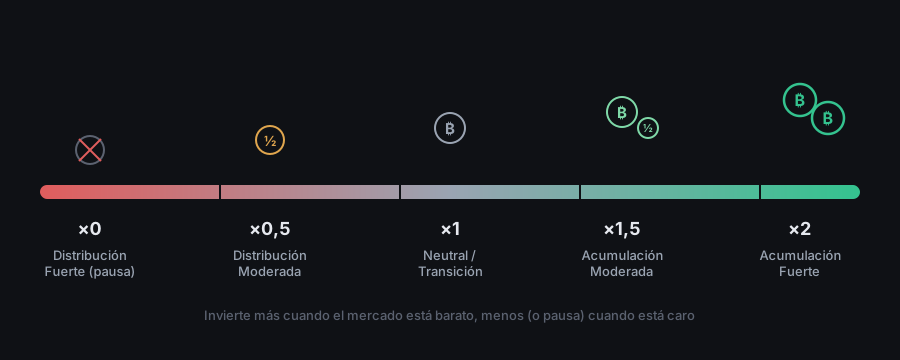
The logic is intuitive: if the Score indicates an accumulation zone (prices historically low relative to the cycle), it makes sense to take advantage and contribute more; if it indicates a distribution zone (prices historically high, more risk), it makes sense to contribute less or pause. In practice, Score DCA multiplies your base contribution according to the phase:
- Strong accumulation: invests double the base contribution.
- Moderate accumulation: invests one and a half times.
- Neutral / transition: invests the normal contribution, same as traditional DCA.
- Moderate distribution: invests half.
- Strong distribution: pauses that period's contribution.
Does the money that isn't invested get lost?
No. When Score DCA contributes less than normal (or pauses), that difference doesn't disappear: it's kept as a reserve and used in addition to the normal contribution during the next accumulation phase. So, over time, all the planned money still ends up invested — it's just concentrated more in the cheap phases and less in the expensive ones.
An important detail: Score DCA doesn't need to "predict the future" to do this. Each period decides using only the information available that day, just like you would. It's not a trick that only works by looking at the past with an unfair advantage.
An honest warning
At NodeWitness, Score DCA is a simulator, not a robot that invests for you. What it does is show you, using real historical data, how that strategy would have performed against traditional DCA over the period you choose. It doesn't execute purchases, doesn't manage your money, and isn't an investment recommendation.
And it's honest about its results: it picks the "winner" by annualized return, not by total money invested, and if traditional DCA would have done better over the period you select, it tells you exactly that. The point isn't to sell you on one strategy always winning — that would be false, and with only a couple of Bitcoin cycles no result is statistically conclusive — but to let you compare both with the data in front of you and draw your own conclusions.
How to try it
Unlike a standard DCA calculator, which just projects a fixed plan forward, the Score DCA simulator runs on real historical Score data. Try it directly in the Market section: choose the time range, the contribution amount, and the frequency (weekly or monthly), and instantly compare how both strategies would actually have performed. And if you want to understand where the Score that modulates those contributions comes from — which indicators make it up and where the data comes from — read our Score methodology, which explains the whole system without hype and with a verifiable track record.
Last updated: August 4, 2026