
Bitcoin Buy Signals: What They Actually Measure, and What They Don't
A "buy signal" tells you what to do. A measurement tells you where things stand and lets you decide. This is about the second one — how to compare Bitcoin's relative risk today against its own history, without anyone promising you a price.
Search for "is it a good time to buy Bitcoin" and most of what comes back is either a trading platform's blog pitching its own signal service, or a scattershot list of a dozen metrics — whale alerts, exchange net-flow, RSI, moving averages — stacked together without ever explaining why some of them matter more than others, or what happened the last time that particular signal fired. None of that is a measurement. It's marketing wearing a chart.
Skip the signal, look at the measurement
"Will Bitcoin go up?" has no reliable answer — not ours, not anyone's who tells you they know. The question that data can actually answer is a different one: compared to the rest of Bitcoin's history, is the relative risk of buying now high or low? The first question requires guessing the future. The second only requires comparing the present to the past, which is information that already exists and doesn't need to be invented.
What has historically lowered relative risk
Four signals have coincided, across Bitcoin's previous cycles, with moments of lower relative buying risk — never "guaranteed rally," only lower risk compared to the rest of the cycle:
- Low valuation: MVRV below 1, meaning the market as a whole is underwater relative to its average acquisition cost.
- Miner capitulation: a very low Puell Multiple, a sign that even the business of mining Bitcoin is struggling.
- Extreme panic: the fear and greed index at its lowest zone — a contrarian signal, widespread panic has historically coincided with bottoms, not tops.
- Deep drawdown from highs: price well below its recent all-time high, another way of measuring that much of a correction has already been absorbed.
One signal is not a verdict
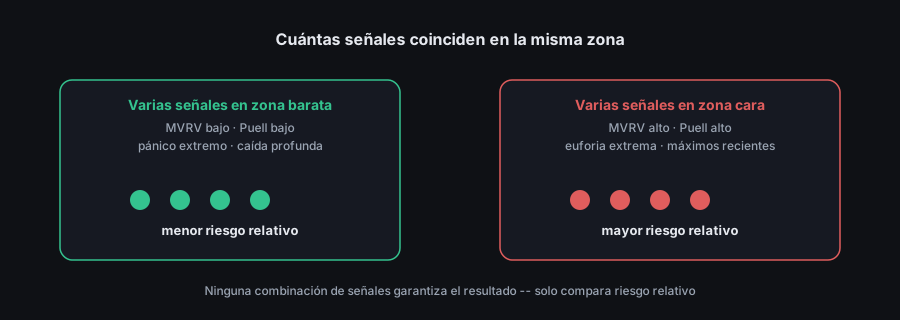
Any single one of these four signals can get stuck in a cheap zone for months without price moving — some have stayed there for over a year during long bear markets. That's why the NodeWitness Score doesn't act on one signal alone: it combines ten, requiring several to agree before classifying the moment as an accumulation zone. The more independent signals pointing the same way, the sturdier the reading — but it stays a reading, never a guarantee.
November 2022: a real case, tracked in public
A real, already-verified example: after FTX collapsed in November 2022, the Score marked +51.1 ("Moderate Accumulation") while headlines were calling Bitcoin permanently broken. With the data known today, it was a genuine cycle bottom. That's the kind of case "buy signal" marketing loves to show you.
The track record includes the misses
What that marketing rarely shows is the other half: the same Score has also been wrong, more than once, and those cases are published with their exact numbers in where the Score has failed — not buried, not excluded from the sample. A signal service that only ever shows its wins isn't giving you a track record, it's giving you a highlight reel. A past hit is no guarantee of a future one, and the only way to judge a method honestly is to see all of it, misses included.
What this isn't
This is not investment advice or a personalized buy signal. Your financial situation, your time horizon and your risk tolerance are yours, not ours, and no on-chain indicator knows them. If comparing individual signals still feels like too much work, dollar-cost averaging is a deliberately simpler alternative that skips timing altogether — it's not a worse approach, just a different trade-off. What this article, and the Score, can offer is an objective framework to compare the present against history. The decision, with all the information in front of you, is still yours.
You can see what phase the market is in right now, with all ten combined signals and the reasons behind the verdict, on the live Score page — free, no sign-up, with public methodology and a verifiable track record of hits and misses.
Last updated: August 6, 2026