
2,255 Strategies, Zero Survivors: A Pre-Registered Backtest Against Dollar-Cost Averaging
A pre-registered, walk-forward backtest of 2,255 trading strategy variants across Bitcoin, Ether, gold and the S&P 500: real trading costs, real perpetual funding rates, real capital-gains taxes, one untouched test set fired exactly once. None cleared the bar. Plain, boring dollar-cost averaging did.
Zero out of 2,255. That's the headline, and it's the one we pre-committed to publishing whichever way the number landed. Five strategy families with academic backing, a closed grid of parameters, an optional exit-management overlay, and a validation protocol borrowed from clinical trials rather than trading Twitter. Fix the success criteria in writing before computing a single result, hold out a test partition nobody touches until the very end, fire it once.
The design, in five lines
Five families with real academic grounding: breakout, moving-average crossover, mean reversion, time-series momentum (the canonical TSMOM benchmark), and volatility-targeted momentum, plus an optional exit overlay (stop-loss, take-profit, trailing stop). The closed grid produced 2,250 individual variants plus 5 blended portfolios, 2,255 lottery tickets. Walk-forward split: optimize on a training partition, select on a validation partition, and touch the third, test, exactly once, at the end, with no do-overs under any circumstance.
The verdict
Of 10 possible champion slots (one per strategy family, per long-only/long-short flavor), only 6 were filled; the other 4 sat vacant for lack of sufficient clean data or because no candidate survived the stability gate. Of those 6, exactly one, a breakout strategy long-only, also survived the robustness gate against shifted start dates and price perturbations. It was the only real candidate for "clearly effective" that reached the single test shot alive.
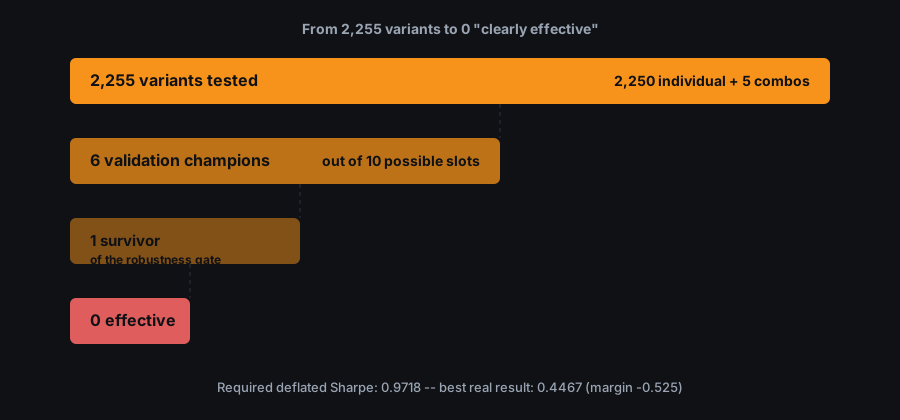
That's where it was decided. The bar was the deflated Sharpe ratio, a threshold that rises the more variants you've searched through, precisely so the best result of a wide search can't pass itself off as skill. With 2,255 tickets in play, the bar landed at 0.9718. The lone survivor's mean Sharpe was 0.4467: a margin of -0.525, not even half of what was required. And it wasn't only that filter. The same strategy that beat buy-and-hold in 3 of 4 assets in validation dropped to 0 of 4 in test, exactly what you'd expect from a result indistinguishable from noise.
Shorts don't pay for their own cost
One of the founding questions was whether the more ambitious half of the project, also winning on the way down via short positions, covered its own cost. Answer, using real historical perpetual funding data rather than an estimate: almost never. With real funding applied to both legs, the short version of a strategy beat its own long-only version in only 2 of 8 asset-strategy pairs in validation and 3 of 8 in test. If this research ever became a product, it would have to be long/cash, never long/short.
Realized-gains taxation turns gross winners into net losers
Gold is the textbook case, and it's worth stating the caveat up front: this experiment modeled a Spanish capital-gains tax schedule (progressive savings-income brackets, 19% to 28%), not a US one, but the structural finding generalizes to any realization-based tax regime. The two best-performing strategies on gold closed validation with +1.1% and +1.0% gross return, and -0.6% and -0.7% net, a tax drag of 158% and 174% of the total gain. How do you lose more to taxes than you made? Because a rotating strategy realizes gains in the good years while losses in the bad years that follow don't fully offset them within the same window. Buy-and-hold and DCA defer nearly all of that tax event to the end. That deferral isn't an accounting footnote: it's a structural edge any strategy that rotates has to overcome before it produces real value.
Absence of evidence, not evidence of absence
This experiment doesn't prove no method can beat DCA. It proves that, with the data available, none can be shown to, which is a different claim. Bitcoin has barely four complete cycles of history, and the entire universe reduces to a few dozen genuinely independent trend episodes. With that little sample, any single result is dominated by one or two large events, and testing 2,255 variants guarantees something will look good by pure chance, hence a bar that scales with search size. Bootstrap confidence intervals on the Sharpe ratio cross zero in nearly every case: there's no statistical basis to claim these strategies have a positive Sharpe, and none to claim a negative one either.
One thing did survive the test, worth stating precisely because it's descriptive, not a verdict on efficacy: trend following's drawdown reduction was real and consistent. The surviving strategy cut Bitcoin's worst validation-period drawdown against buy-and-hold from -76.6% to -42.8%, and that cushioning held up in test too: -38.5% versus buy-and-hold's -53%. What it never did was turn that protection into better risk-adjusted return than DCA. Protecting the downside cost too much of the upside.
What we're doing with this at NodeWitness
This project is fully separate from the NodeWitness Cycle Score: different asset universe, different methodology, not a line of shared code with the engine that computes our Score. Yet it arrives, through a completely independent path, at the same conclusion we'd already reached auditing our own Score DCA simulator: no demonstrated edge over plain DCA either. Two separate experiments, two different methodologies, no coordination between them until this article. Same answer.
That doesn't close the question. It pushes it forward. The only dataset that's still clean, never used to calibrate or select anything, is the future. That's why, instead of shelving this research, we opened a daily, sealed, append-only log of the signal the sole surviving strategy would have emitted every day since, with no real money involved. Why backtests lie, even the careful ones, is the subject of the next piece in this series, with the real bugs an external audit found in the simulation engine before test was ever touched.
Nothing in this article is investment advice, and nothing on NodeWitness is: the Cycle Score is informational, never a buy signal, and this experiment is a fairly precise illustration of why that caution holds. You can follow the live Cycle Score or read where our own Score has failed, same discipline of publishing what doesn't work, not just what does.
Last updated: August 5, 2026