
Bitcoin Valuation Without the Hype: MVRV, Puell Multiple, and the 200-Day Average
Most "is Bitcoin cheap or expensive" content either sells a paywalled dashboard or tells you what to do next. This is neither: three public on-chain signals, how they combine, and an honest list of what none of them can tell you.
MVRV, the Puell Multiple, and price vs. the 200-day moving average are well-trodden ground -- Glassnode, Bitcoin Magazine, and a dozen crypto research blogs have each explained what they are. What's rarer is a source that shows all three together, keeps the methodology public instead of behind a paywall, and is upfront about where these signals have been wrong before. That's the gap this article fills, not another 101 explainer of what MVRV stands for.
Why "cheap" and "expensive" are relative, not a price tag
$90,000 isn't inherently expensive or cheap. It depends entirely on what the network, demand, and mining economics looked like when the coins now in circulation last changed hands. That's the actual question these three signals answer, each from a different angle.
MVRV: price versus average cost basis
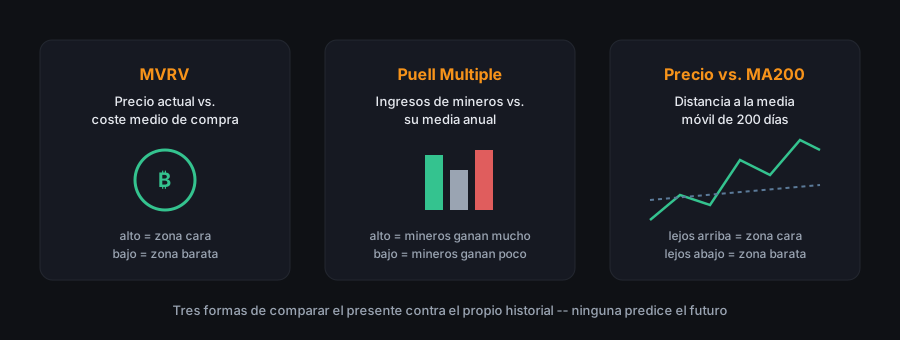
MVRV divides market capitalization (current price × circulating supply) by realized capitalization -- the value of every coin at the price it last moved at, summed across the whole supply. It's a proxy for the market's average cost basis.
MVRV below 1 means the market as a whole is sitting on an unrealized loss relative to what it paid for its coins -- a level historically reached only during the harshest stretches of a bear market. A high MVRV means the opposite: the market is sitting on a large aggregate paper gain, historically a sign of an expensive zone.
Puell Multiple: miner revenue versus its own average
The Puell Multiple looks at the supply side: daily miner revenue from new issuance, divided by its own trailing 365-day average. It's a proxy for forced selling pressure, not demand -- miners have fixed costs (power, hardware) to cover regardless of price.
A very high multiple means miners are earning far more than usual, something that only happens after a sharp price run, historically clustering near cycle tops. A very low multiple means miner revenue has fallen well below its own average -- some operating at a loss -- a pattern that has historically clustered near cycle bottoms, roughly the point where forced selling has little room left to intensify.
Price versus the 200-day moving average
The simplest of the three, and the only one you can check on any price chart without touching on-chain data: how far the current price sits from its own 200-day moving average. Well above it, price has outrun its own recent trend -- a relative "expensive." Well below it, price has fallen faster than that trend -- a relative "cheap." It's also the least discriminating of the three: it can't tell a healthy pullback inside a bull trend from the start of a bear market on its own.
Why nobody serious reads just one of these
Each of these three signals can stay stuck in a cheap or expensive reading for months, and none of them flags the exact moment a trend turns. That's precisely why most credible on-chain research treats them as inputs, not verdicts -- and why the NodeWitness Score combines all three with market sentiment, exchange flows, and data computed from our own Bitcoin node, requiring several signals to agree before calling a market phase. What's less common is publishing that methodology in full, including where the Score has been wrong, and keeping the core cycle metrics free instead of gated behind a research subscription -- see the full comparison against paid alternatives for what that trade-off actually looks like.
What none of this predicts
None of these three signals -- nor the Score that combines them -- predicts Bitcoin's price tomorrow, next week, or next year. They measure where the present sits relative to the past, not where the future goes. Bitcoin has hit historical lows on MVRV and the Puell Multiple and kept falling for weeks afterward; it has also hit historical highs and kept climbing. Their value isn't calling the exact turn -- it's replacing a gut feeling of "this looks overbought" or "this looks cheap" with something you can check yourself.
See all three indicators computed with live, current data, alongside the rest of the signals behind the Score, on the live cycle Score page -- free, no sign-up, methodology published in full.
Last updated: 2026-07-30